Slagging

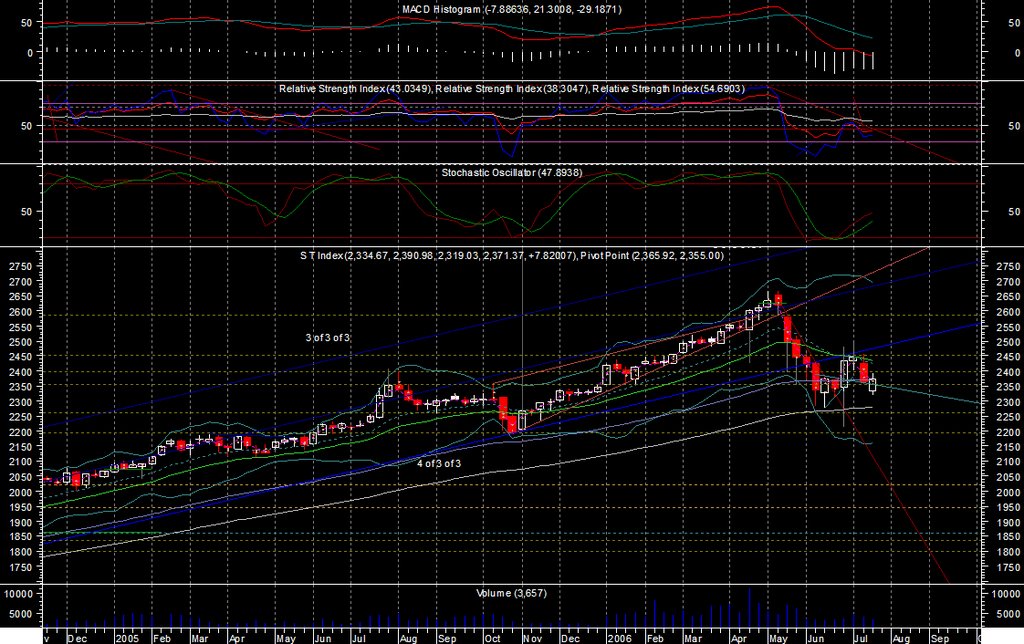
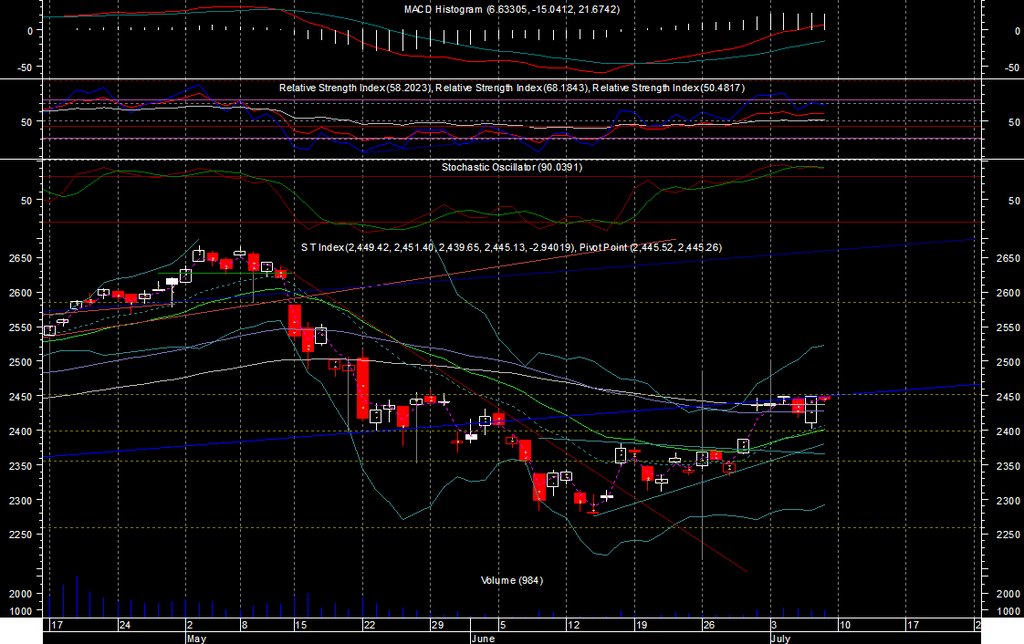
Fig 1. STI Daily Chart
I have been slagging for the past few weeks. Even for today I have to drag my feet to my computer. I am not sure why, but part of it has to do with my schedule for business trip to Sydney, or it may be because my wife is now at an unstable condition, she is pregnant and it is almost time for our baby to pop out.
My past experience tells me thatit is unwise to leave any position open when I am oversea. I have very limited power in controlling my stocks if I do so. Further more , there is a high tendency that the market goes against me whenever I am not in Singapore. So I have been quite empty handed during the last few weeks.
I have also noticed that my recent predictions has been highly inaccurate. Could this be one of the flause that my system has? There were time when I found myself more accurate than now. Could my system be ineffective in a congestion period like now? One thing is obvious,I need to reflect on what I have been doing.
So what am I seeing now? Leaving aside the indicators and the moving averages, the STI is still in a B wave congestion, and it should now be doing the C of B. However, the fibonacci calculation does not support the high and low values that it presents from the chart. Looking at the chart, the up wave started from 14th June 2006 till 6th July 2006 does resemble a ABC wave, B will definitely be ABC. We should then expect an ABC C wave for the major B wave, which according to Fibonacci should be 2,517
On the chart itself, there is a resistance from the trend line, it is presently resisting at 2,472. I feel that it will be difficult for STI to break through this resistance as it was quite strong when STI last revisited. Further more, the indicators are now reaching the top, so it is possible that this round stops here for the time being, if it can break through 2,451 that is.
posted by denzuko1 @ 11:51 PM
8 comments
![]()
![]()