Google
 
Web thoughts-denzuko1.blogspot.com

My Charting Blog

It is interesting that I start off this Blog when the Singapore Stock Market is heading south. However, this makes it more interesting for me to write on as the market turned volatile. My interest is Technical Analysis, TA for short. I love to look at charts and predicting where they are heading. This blog is or me to record my thoughts on the market. The articles on this blog are based solely on my personal opinion on the charts that I read and readers should not take it as absolute.

8/31/2006

Lousy Service Provider

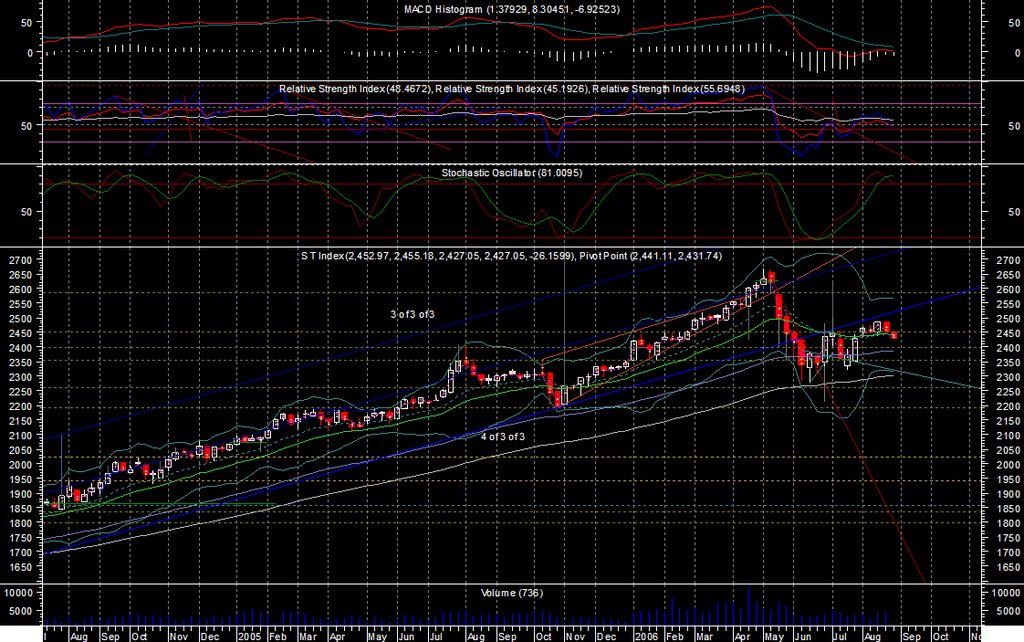
*sigh* Donno what happened but not able to download the data for today. This time I am quite sure its the service provider fault. I am able to download from othe sites except the data which run on a special program.......Guess I won't be able to look at the charts today. Some time I really wonder the logic for the service provider ( Keyquotes in this case ) to shift it's operation to Malaysia. They don't seem to bother about new business at all, they are so reluctant to give me quotes for their data service on other markets.

So what to do? Let's look at USD.


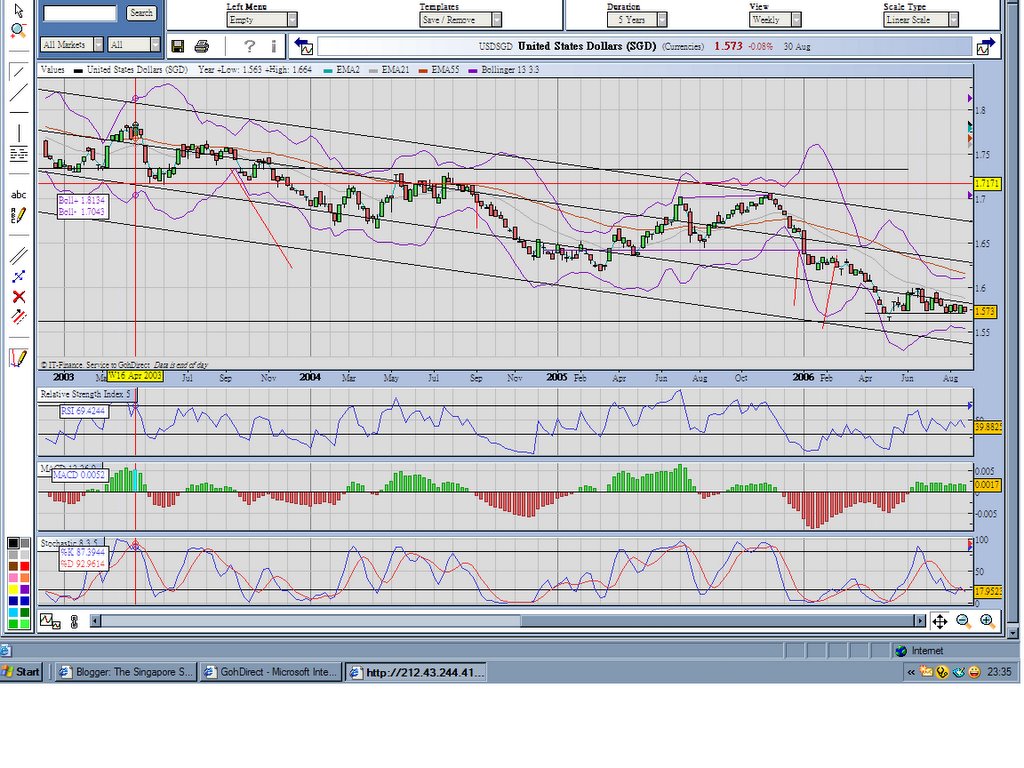
Fig 1. USD Weekly chart

Well, this is not the best program for me to use to look at chart, but for the time being, it will have to do. This is actually from my broker GK Goh, not very fast but equip with sufficient indicators to work on.

I have been eying on USD for quite a while. My wife and I have invested in USD a few years ago for a length of 3 months and we managed to make a little profit of SGD1,000. 1/2 year ago she asked me whether we can go into USD again and I looked. What I saw was that USD has a minimum target at SGD1.55, so I suggest we waited. However, it seems like the unit tried to play trick on us, continued to hover between SGD1.57 and SGD1.60. It presently ends at SGD1.573.

It continues on the down trend, if we look at the chart, we can see that it still falls between the lower part of the channel. The RSI and Stochastic have strong reluctancy to move upward and the MACD's move is not spectacular in its positive region. I am seeing weakness in this counter.

The price itself is on the lower side of the congestion area. No real pattern is visible now and hence difficult to determine the next possible direction. I would still bet that it should at least head for SGD1.55. The formation it is creating at this moment seems to take on ABC pattern, so I feel that it is in the counter wave, so it will be likely to head south, which I think will go lower than SGD1.55. I kind of wonder what the world would be by then. But for the time being, I will sit on the fence and watch.

8/29/2006

The yo-yo relationship with the market

I was born in 1968, as I look back from now, I have already passed my half way mark. Time seems to passed by slowly in the past and I dreaded the passing of every day. Now I am dreading that it is passing too fast.

As far as I could recall, the first yo-yo that I saw was a promotional item from Coca Cola. I am not sure now but I think it was some time in 1973. It only appeared a short while and disappeared from the world quick. The toy again emerged in 1985 and became a hit. Every children would want one. Its design also varies with many fancy colours. However the basic function remains the same. A string attached to 2 circular disc joint together. This time it lasted for another year. Yo-yo appeared again during 1997-1998 as far as I could recall. This time there was a competition and this guy who won went on a round the world tour and again yo-yo became a hit. However, this time round its lifespan seems to be shorter, only a few months.

It is a fun toy, going up and down and you can do fancy tricks. Yet I can't help but to notice that its appearance has coincide with market down turn. It became a hit to the children and teenagers shortly before or after there was a market crash or stock market collapse. In 1973, there was an oil crisis. 1985-1987, market slow down. 1997 the financial crisis. Is yo-yo a cursed toy to the financial market and the way it is played is trying to tell people of the ups and downs of the market? What ever goes up must come down.

While I ponder about this question, I notice that children are starting to play the yo-yo again. It is making a come back to the new generation. Will it also bring about another market down turn? As I read the STI yesterday, I am quite firm that it is heading for 2,245 area. I just wonder, will the curse of yo-yo have a hand in this? Of course it could also be superstition.

Wave C


Fig 1 STI Weekly Chart


Fig 2 STI Daily Chart

Judging from my last entry, it must have been a month since I last wrote my blog. No, I was not lazy this time. My wife just gave birth and we have some complication, a symptom known as Amniotic Fluid Embolism which nearly taken her life. It took quite a while for my family to settle back down.

Although I have not seen the chart for quite a while, reading through my last entry does tell me that I did not miss much. Both daily and weekly chart shows that the STI has not managed to break the trend resistance, which was at 2,472 in my last entry and now reciding @2,513. As I was pondering about B wave earlier, I am now seeing the completion of B wave, which itself should be an ABC wave. I would expect the starting of C wave right now if there is no complex B. With 0.618 calculation, C wave should then be reaching 2,245.

The indication of a down trend is not great with the weekly chart as its RSI and Stochastic is just turning downward. The daily chart however, is more prominant. I am seeing divergence on MACD, RSI and Stochasitc.So it is no wonder that STI is now falling. Its nearest support level would be 2,392 while resisting at 2,451. Its time to head south.