Has the STI correction completed?
It is a spectacular day today for stock market. After the close to world wide plunge yesterday, everyone is wary about how STI will perform today. I stood by the support level of 2,399, and miraculously STI stopped at 2,398.56 and rebounded. At the end of the day, it went back up to a level of 2,438. In total the fluctuation for the day was a total of 40 points. Although a far cry from the recent fall, but no less a wide coverage.
The question in everyone's mind is whether we have seen the last of the fall this round. I was optimistic at the end of the day, firstly it was supported at the level of 2,399, secondly, a strong rebound. Thirdly it seemed to have done a day reversal.

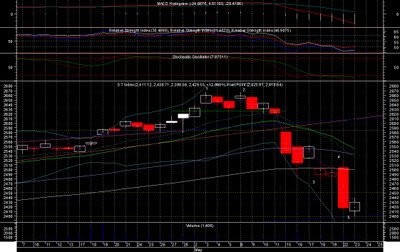
The chart above is the up-date for today. It is clear that today's move have not created any signal of reversal, both by candle stick nor classic reversal pattern. The volume has not supported the up-ward movement and all the moving averages are resistance to the index. Further more, all indicators are still down with no indication of divergence.
The only thing that make me feel that it has completed this round is the 5 wave movement with the low meeting the Fibonacci calculation @ 0.618 of wave 3 from 2,665 to 2,478. However, this 5 wave move does tell me that we are in a counter wave movement and we should be meeting the zig zag B wave.
So at the end of the day are we seeing an up-trend? I suspect so, although more is needed to confirm a reversal. How far is it going? If calculation is right, we should see the level of either 2,563. Meanwhile I would caution on the level of 2,499, 2,545 for the time being.
For those who are already in the market again, just be cautious.

2 Comments:
Agree, wave a consisting 5 smaller impusive down waves has completed at around strong support 2400, a rebound is in cards. We are entering a consolidation phase that will be lasting for weeks. Painful!
We have seen complete 5 waves, no doubt, indicating further losses after a wave b rebound.
Post a Comment
<< Home