Malaysians are getting poorer...?
I want to talk about Malaysian Ringgit (MYR) today. The constant complaints recently on youtube.com that feature Malaysia political situation kept talking about weakening MYR leading to inflation. This causes goods becoming more expensive to the locals.
It is quite true, my travel back to KL has increased in frequency after rules were relaxed, I experienced on my return each time that things were getting more expensive, especially food.
There was this noodle stall that was my favorite. Its bowl of noodle used to be MYR5.00 before lock-down and it is now MYR8.00. This is an increase of 60%!
I didd a piece of article on Asean's currencies including MYR titled All the disruptions....and is Asean in trouble? in July 2022, I compared MYR with SGD then, I estimated the next resistance for MYR to be between MYR3.25474 to MYR3.32340. It apparently breached the lower resistance level on 11th August 2022.
Today I will conduct a more thorough analysis of MYR comparing it to both USD and SGD.
Fig 1. MYR Weekly Chart
MYR was in a congestion band since 2017. I find it quite interesting as at certain point of time between 2015 till 2018, it was very close to breaking the neckline and it came true. We would be having a very different reality now.
It coincides with the last general election of Malaysia. It seems like the market did not like the coalition that took over BN and know that it would be a disaster.
Since then, a multiple-year triangle was form and break-out happened on round 8thMay 2022. Using the triangle formula, I see an objective of MYR5.009 per USD.
This is a strange sensation for me, I have heard about MYR5.00 per USD. It was a joke that my teacher told the class during my technical charting class.
The joke went like this:
" It was 1998 and in the midst of the Asian financial crisis, Soros and his team of fund managers were attacking the Asian currencies, MYR was depreciation fast.
The prime minister at the time, Mahathir, called Soros and said, " Mr Soros, the situation is getting very serious here right now. The outcome is not going to be good. How about we arrange a meeting for a discussion and see what we can do about it?"
Soros agreed and said, " I'll see you at 5 then." "
Of course, MYR5.00 per USD did not come true then, it was close at MYR4.70. Mahathir played punk and fixed the exchange rate at MYR3.80 per USD, he also limited the outgoing MYR to MYR10,000 per person per time to stop the bleed.
It worked but with a bitter aftermath. The integrity of Malaysia's economy took a hit and investors shy away for years. It was one of the last countries to fully recover from the finance crisis.
Let's get back to the chart on the Fibonacci set up.
There are 2 possible zig zags that I can use for this counter.
Using set up in blue, I can see resistance at MYR4.80 to MYR5.40.
As for the shorter term set up (part of the triangle), resistance at between MYR4.359 to 4.585. MYR is presently within this zone. At the same time, the 100% expansion measurement indicates resistance at MYR5.035.
For the time being, all indication is heading to MYR5.
Seems like Soros is going to meet with Mahathir after all.
Let's move on to SGDMYR, this is closer to my heart.
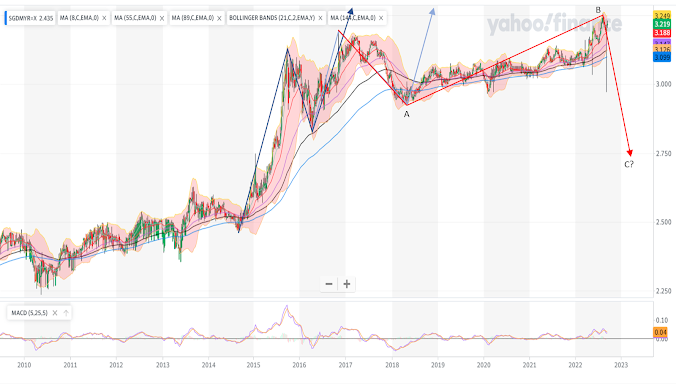
Fig 2. SGDMYR weekly Chart
The behavior of this pair is different. There is a long stretch of congestion between 2018 till 2022 and MYR is seen weakening further. It seems that SGD is a much stronger currency and manage to withstand onslaught of USD more than MYR.
However, I nevertheless feel a little troubled as I am seeing slight contradiction on the chart.
Let's look at the positive part of this chart first.
Again, there are 2 Zig Zag set ups that I can use for projection measurement. Using the blue set up, I can see resistance at between MYR3.2208 to MYR3.4630. It broke the lower resistance level, retreated and now the same level is resisting its ascension.
Using a shorter term set up, the more immediate resistance level is between 3.15442 to 3.2950.
There is one question here, if the lower level is crossed, why would I still mention this?
Fig 3. SGDMYR 4-Hourly Chart
It can be seen on the 4-hourly chart that these levels do affect behavior of the counter.
I mentioned about the troubling factor, what is it?
It has something to do with the chart behavior itself. Considering the RED line in fig 2., I can't help to consider the possibility of a counter wave after the ascension (or in this case, the descension of MYR).
The loooonnnnggg stretch of congestion between 2018 till now is a possible B wave of the counter wave pattern, and we might be seeing C.
As can be seen from Fig 3, the recent movement of the pair seems to show some kind of failure in its climb and MYR is testing its 55,89 and 144-moving averages with weakening of 8 and 21-moving averages.
While the weekly chart maintains its strong support of further up-trend of the chart, it is worth taking note of such signals as the chart is trying to tell me something.


0 Comments:
Post a Comment
<< Home