Chain of Coincidences
It has been quite a bad week for me, starting with falling sick due to flu virus, causing aches at the joints of my bones. Then my modem was down*sigh* However, something good did turn up due to the pause, the STI is allowed time to create a pattern for clearer reading.
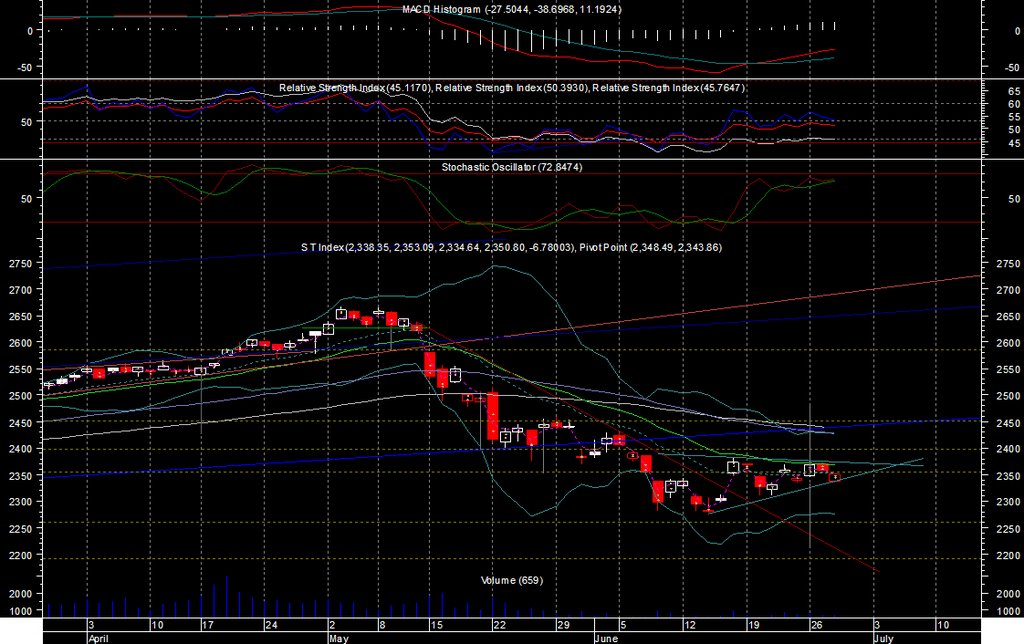
During this period, it has an opportunity to develop an ascending triangle, theoretically, this pattern means an up trend. The measurement would result in STI heading for 2,438. However, in the case of possible down trend, it will hit 2,212. For the time being, I will bet onto the higher probability which is up.
The indicator is kind of mix, with RSI turning south while Stochastic heading North. Recently I learn to sit on the fence until clearer sign is given to me. At the moment, there still seem to have confusion in the market. However, in general, the trend is still up for the time being ( indicated by MACD ).
STI will still be affected by the few support level. At present it hovers at the support of 2,355. Next level is 2,398 and follow by 2,451. Well so far so good. As for the influence of the Fed with many expecting a rate hike, my take is that the market already factored this in, so it may not have a great negative influence on the market in the end.
posted by denzuko1 @ 11:47 PM
![]()
![]()

1 Comments:
Feeling better enough for a STI chart analysis? Toptrader 01 Jul 06
Post a Comment
<< Home