What's with USDJPY and where is theading?
With the re-opening of the border, I took the opportunity to drive back to Kuala Lumper last week to visit my parents.
I don't go home often as I have chosen Singapore as my more permanent home. Eveery time home, I will do my best to spend more time with my folks and bring them around and enjoy some good food. Tour is no longer an option considering their age, even crossing state is a challenge.
As a result, I am late on my entry.
I did an entry on USD earlier indicating its strengthening aginst other currencies. In my last entry, I did a more detail analysis on EUR and GBP against USD. However, I hesitated on JPY. Unlike other currencies, USD is on a run away surge against JPY.
I changed my mind this week. It is still worth checking up on. So what is happening on JPY?

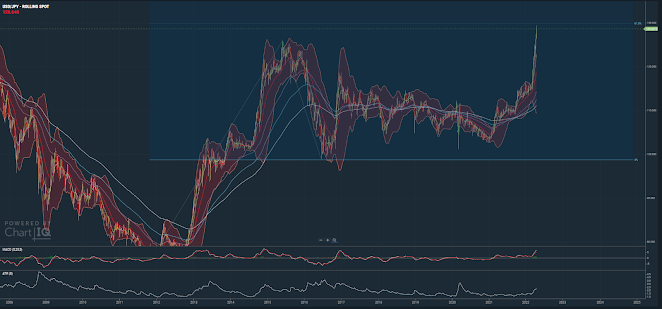
Fig. 1 USDJPYweekly chart 2016 - 2022
Let's first look at the range between 2016 to 2022. It is quite clear here that USDJPY is completing a Zig Zag move, using projection, it crossed its 127% projection mark. However, it thus far have not indication of reversal.
With its congestion stretching from 2017 to 2020 horizontally, The burst will have to travel a similar stretch vertically.
Then is there any other indication of resistances in its path?
We are now moving further back in time to 2012, It can be seen with a steep ascension prior to its correction by mid 2015. The drop between 2015 to mid 2016 provide a projection measurement. Here we are seeing USDJPY is reaching its 61.8% projection. This resistance level in my experience marks a correction phase after its escalation. The next resistance is 149.302. Is there any support level at this moment?
I am not very sure as the the moving averages are also at a steep climb, If I am to watch out for would be its 55-weeek moving average. So what else am I seeing on this chart?

Moving further back in time to 2002, it is interesting to note the formation of a reverse head and shoulder, What's more alarming?
It's recent surge has broken the neck line of this formation, meaning a chance for it to reach 176.35! Can this even be possible?
It is a possibility, but it is also possibly be much further in the future. The more pressing objective is to determine the most immediate resistance level. So where should we be setting alarm for JPY?
I can find 2 levels,130and 149.
130 is the 61.8% projection resistance and with such steep climb, there is a chance that a correction is around the corner.
149 is not only that this is the 100% projection level, it is also a reversal point in the year of 1998.
While 149 is quite far away, 130 is likely to be reached either this or next week. It is worthwhile to maintain close observation at this point for one who trade in this currency.
Labels: JPY
posted by denzuko1 @ 4:05 PM
![]()
![]()


0 Comments:
Post a Comment
<< Home