Google
 
Web thoughts-denzuko1.blogspot.com

My Charting Blog

It is interesting that I start off this Blog when the Singapore Stock Market is heading south. However, this makes it more interesting for me to write on as the market turned volatile. My interest is Technical Analysis, TA for short. I love to look at charts and predicting where they are heading. This blog is or me to record my thoughts on the market. The articles on this blog are based solely on my personal opinion on the charts that I read and readers should not take it as absolute.

10/19/2024

Is Japan on continuation upward?

I was going through all my entries contemplating what I shall explore this week. 

I first looked at Dow Jones and noted that it is on its way up with potential objective of between 45,000 to 47,000. I guess that it may not be the right time to conduct a study on this counter. It was only September that I have made an entry on this. I believe that with Dow will continue to climb until the completion of the US election, which reversal will appear, after all, the trading market is always about anticipation.

What shall I research on then?

It was about 2 months ago that I made an entry on Japan situation through The curious case of JPY-Nikkei divergence on 4th August 2024. I guess it is about time that I check on this counter, then.


Fig 1. JPY weekly chart

In my last entry, I estimated the possibility of correction before further downslide (JPY strengthen against USD). Unfortunately, JPY refused to wait and in continuation without correction. While it managed to reach new low, there was a lack of momentum and reversed upward after re-bounced from its 144-week moving average support.

The question here is: Is this a correction or trend reversal?

Based on the chart, there are a lot of indications of an uptrend (check out the arrows). The issue here is that the uptrend started by the end of 2023 has a reduced level of momentum. The reversal by June 2024 witnessed a steep decline before it reached its 144-weeek moving average support.

What's more, there is a divergence on MACD, providing more justification of down trend (JPY strengthening against USD). 

I still believe that JPY is on a correction phase with resistance at 153, its 61.8% retracement and projection. It may reverse and continue downward thereafter.

On continuation downward, it is crucial to note the support at 139.58. This is the previous low which turn the neckline. Should JPY cross this level, we should see support at 125.73 with its objective at117.226.


Fig 2. Nikkei weekly chart

In my last entry, I noted Nikkei to continue its down trend with minimum objective of 32,039, considering a double top formation, with additional support from its 144-week moving average at 32,217.

The momentum of its down trend was so strong that Nikkei plunged below my estimated levels, reaching a low of 30,632. This followed by a strong recovery with a hammer candlestick indicating a reversal upward. 

While there was divergence on MACD prior to its fall, I think its predicted move might have been fulfilled. It has been climbing up since then only to congest at its 61.8% projection. I believe that it will continue upward upon breaking through this congestive level. 

There will be a few resistances ahead though. the first resistance zone between 40,970 to 41,620. The next resistance level after crossing this will be between 42,843 to 43,301. This zone will be stronger as there is a total of 3 projection resistances in this zone.


Labels: , ,

9/08/2024

It is tumbling down, but it is not yet for Dow Jones

I remember it was a day of tumble on Dow Jones, leading to a group of anti-Biden-Harris using it to determine that US market is collapsing and that it is due to Harris' proposal. 

That was a month ago that happened to be Singapore's national day. I wanted to complete the Singapore's read first before continuing with proceeding to checking on the US market. After all, it was only a single week of downturn and insufficient for me to determine a reversal.

unfortunately, what followed led to further delay in my entries.

First off, my wife's family gathering used up one of my week. Then a gout attack on the second weekend caused me to take some pain killers, but the wrong prescription from the pharmacy caused me to take anti-depressant instead.

At least I know now that it did not make my less depressed, but instead I was attacked by continuous drowsiness and slept throughout the weekend with no improvement on my swelling and pain.

Then I had a week's off going back to KL, focusing on my mum's needs.

Finally, this week, I get to sit down and work on this entry.

I have been following the US political arena and if you are observant enough, you will notice that US is on deterioration as a country. It is very deep in debt while the politicians lack the will power to bite the bullet and move towards austerity. 

They attempt to distract the people into focusing on personal gain, ignoring the more pressing issue what the country is heading into the abyss of down fall. 

Having said that, I believe it is not yet time for US to collapse. There is a Chinese saying that 'even a rotting ship contain 3 portion of iron nails'. There are sufficient talents and resources in US for it to stay afloat, if they play their cards right.


Fig 1. DJIA weekly chart

Since the tumble a month ago, Dow Jones actually reached a new high after its fall stopped by the 21-wek moving average, only to 'tumble' again this week. Strange that there is no comment from anyone this time. Is it because the event does not match the narrative?

Ok, let's stay objective in looking at Dow Jones chart. 

The Dow just reversed from a major 100% projection, crossing and stayed below its 8-week moving average. The gradient of ascend remained gradual, indicating a weak momentum. The potential of a downward movement is increasing. 

On the other hand, it has not produced any reversal candle stick. Neither has MACD shown any divergence, indicating that there might be some upside. 

I suspect it may still be another correction with the next support at the 55-week moving average of 38,060, which is mildly above the Bollinger envelop of 37,824. If this happens, it crosses a crucial point of 38,390, which become a neckline for double top base on the present set up, this will lead to a new objective of between 35,389 to 36,708.

On the upside, its immediate resistance is between 41,773 to 42,2185.

For the time being, I do not see that Dow Jones is crashing, at least not yet. However, the same can't be said for its currency.

Let's look at JPY first.

Fig 2. JPY weekly chart

My last entry on JPY was The curious case of JPY-Nikkei divergence, I noted JPY strengthening against USD, with downward potential of 143.141.  As of today, it crosses this level reaching a low of 141.6770. It corrected after the support from Bollinger envelop, it continued its decline but more gradual with present low still above the earlier level. 

Based on the present set up, I do not have upward measurement as there is still no reversal nor divergence indication. So, I will assume continuation downward with further strengthening of the currency against USD.

The next support level is between 129.176 to136.906.

If I am to set an up-side resistance, it will be the 55-week moving average of 149.2248.

Guess I should be seeing more downside on Nikkei since it always move in the opposite direction to JPY.
Fig 3. EURUSD weekly chart

My last entry on both EUR and GBP is Divergence between GBP and EUR dated 3rd Sept 2023. That was more that a year ago. I suspected at the time that EUR and GBP might part their ways. They did not, both continued to weaken against USD for a short while before reversing back up.

I see from the latest chart that EUR is correcting after crossing its 61.8% projection resistance now turning support. It remains above this level of 1.10258. I believe that it should further strengthen against USD with next resistance level between 1.12922 to 1.14787.

One point to note here is the previous high of 1.2759, this coincides with the 61.8% retracement level which is also very close to the 100% projection resistance.  I suspect it may be difficult for EUR to break this point. 
Fig 4. GBPUSD weekly chart

GBP actually fair batter than EUR, it crosses its previous high of 1.31425. It presently retracted from its 100% projection point in what seemingly a congestion at this point. It may hit higher after this.

The next resistance for GBP should be 1.33897 to 1.37742.

One point to note is the gradual gradient of the uptrend for these 2 counters. I suspect while both currencies strengthen against USD, they may be negotiating a top formation. But I think it may take some time before reversing downward.

In conclusion, it is not Dow Jones that is going down, but USD certainly shows much weakness at this point of time. The most important asset of USA is its currency that is used in all international trade. But generations of US politicians take it for granted and print USD as a quick fix for all their problem. Its debt is in level of Trillions, an amount unseen in history. If USD breaks, it signifies the collapse of USA.  

Labels: , , , ,

8/04/2024

The curious case of JPY-Nikkei divergence

July this year is really a crazy one for me, lots been happening. My son's project, from his course as well as the competition, Noy to mention my daughter is finally started her journey through University. 

Finally, life is settling down by the end of the month and what happened on arrival of August? 

Nikkei was down 1,733 plus points in one day, while whole day fluctuation reached a range of 2,388, closing at 34,928.

While this was happening, JPY strengthened by 2.803, with fluctuated range of 3.361, closing at 146.5560.

I am not sure what happened as I was still trying to re-adjust back to my normal life. But my interest is only on the chart. So just look at the chart.

I did an entry on Nikkei "Is Nikkei firm on continuation downward?" on 1st of June 2024 and JPY in JPY is....ENGULFed!!! dated 4th of May 2024. I estimated a potential reversal then for both counters. They did not, at least not yet at the time. Both counters went on further continuation only to reversal after hitting the Bollinger envelop.

So what is happening now?


Fig 1. JPY weekly chart

JPY reached the 61.8% level of a major projection before it reversed, and the reversal was with momentum. Its descend even dropped below its 55-week moving average this week, closing below the level only supported by its Bollinger envelop.

I rarely use project such reversal as it went above the previous high. However, due to its gradual gradient  upward after a steep drop, I believe his is applicable. 

Using the projection measurement downward, it can be seen that JPY already dropped below its 161% level and 23.6% retracement line. 

The next level of support will be its 89 weeks moving average at 145.601, beraking this point, the nextr level of support will be 139.811, which also coincide with its 38.1% retracement (138.645) and its 144 weeks moving average.

Having said that, it was a steep drop this week and I believe a correction or congestion in the coming weeks before continuation.

If I consider the recent formation a double top, it is possible to measure an objective, which is 143.141. This also mean a potential retracement back to its neckline at 151.859 before continuation.

Fig 2. Nikkei 225 weekly chart

When I look at Nikkei 225 chart, I can't help but to note that similarity between Nikkei and JPY at this point of time, except that Nikkei is weakening while JPY is strengthening. 

The difference is that Nikkei crossed the 100% of its major and minor projections while failing to reach its 127% major projection resistance, it crossed the 127% minor projection before retreating.

Using projection measurement downward, similar to JPY read, it is noted JPY is presently supported by its 161% projection (34,973) which coincide with its Bollinger envelop (35,442), closing at 34,928 at the end of the week.

Similar to JPY, I expect a potential correction or congestion before continuation downward. Like JPY, I can also consider a double top formation with a minimum objective of 32,039 which with neckline of 36,688, the retracement may reach back to this neckline before continuation, this also coincide with its present 144-week moving average at 32,217.

This one thing I do not understand is why the continual divergence which JPY does not follows the behavior of Nikkei. In general, a rise in index would indicate a long for shares therefore an increase in demand for the currency, vice versa. With such a sharp fall on the index, I would consider an exit from the market leading to weakening of JPY, yet the demand of the currency increases. Unless someone is accumulating and expecting Nikkei to go higher.

Anyway, I believe this will be an issue of fundamental analysis.

Labels: , ,

5/04/2024

JPY is....ENGULFed!!!

It is quite a hectic week this week. Not because of volatility in market movement, but there is a public holiday in the middle of the week, running errant for my wife the day after, and my daughter's graduation ceremony. 

She has completed her 3 years of study in Singapore Polytechnic, the same one I went after my GCE "A" Level failure. It was the turning point for me, climbing back up after a major failure. My daughter also shared my experience, it was her lowest point when she did badly in her GCE "O" Level. 

It is through Singapore Polytechnic and its diploma courses that helped us finding our path. I went forth to obtain a degree from the University of Bradford then while my daughter is now accepted by the National University of Singapore, a prestige institution in Singapore. 

I have been telling my children that " it is not about falling down, but getting back up", which is why I allow my children to fail. 

My son with a lack seriousness dealing with his PSLE, he failed to enter the school of his choice. This failure led him to treat study seriously and he redeemed his honor through his GCE "O" Level result. Although he still tends to slack off, every failure to him triggers loud alarm in him with a sense trigger warning, and this helps to guide him back on track.

My daughter on the other hand hid her incompetence due to embarrassment in admitting her weakness. As a result, she did not seek help from me until it is too late, her failure led more conversation between us. Even though she is still stubborn, she is willing to share her situation with me.

Same thing with trading, it involves a lot of failures before I can succeed. The most important thing is to ensure I get back up. This involves dropping my own arrogance and reflect on my own action.

Enough of my chit chat. What shall I look into today?

I have early mentioned about the Nikkei reversal, I did not check on JPY. The last time I did a piece on JPY was Nikkei & JPY divergence dated 25th June 2023. It was due to my curiosity on the divergence between JPY and Nikkei at the time. Even so, I only estimated resistance between 145 to 149. It hit a high of 159.881 this week. 

Is the depreciation of the Yen with no end? Considering that I foresee the weakening of the Nikkei, surely JPY should align with the direction of Nikkei by now.


Fig 1. JPY weekly chart

While I estimated in my earlier update that JPY continued to weaken, breaking my resistances of 145 and 149 respectively. It even cut through the previous high of 151.937, reaching a new high of 159.961. This coincides with the 61.8$% projection of both a major and minor move (blue lines), resisting its advance.

At the same time, there are signs of weakness, with divergences observed on MACD on every new high on Nikkei. 

What's more? 

A long downward bar formed by the end of this week after reaching a new high, only to stop by the 8-week moving average, resulting in an engulf formation. this is a reversal pattern but requires confirmation from the next bar.

These are signs of JPY reversing, meaning that it will get stronger than USD at least in the coming weeks.

So where do I see the support?

Using projection, it can be observed support zone of between 134.9388 to144.5568, which also coincide with its 144-week moving average of 135.9637 and 145.8182.

JPY will be quite interesting in the coming weeks, especially when JPY continue diverge with Nikkei

Labels:

6/25/2023

Nikkei & JPY divergence

I was pretty aimless this week, a little unsure what I should discuss for this week's entry. 

While going through the forex pairs, I noted something interesting on JPY.

As I mentioned in Nikkei run away surge on 20th May 2023, Nikkei was surging upward. Further to that I also mentioned in EUR GBP comparison on 6th May 2023, both GBP and EUR were strengthening against USD. I also noted in Occult always lead to eventual collapse on 17th June 2023 that it was USD weakening against major currencies.

With Nikkei continue its uptrend, I would expect JPY to be stronger against USD.

Fig 1. Nikkei weekly chart

Since my last update, Nikkei made further progress and has in fact reached its 100% expansion level, coincidentally the double bottom objective. It is also at 61.8% projection of a its major trend, while 161.8% projection of a minor trend.

This week, I saw Nikkei retreated from its resistances. However, a single bar of reversal requires more development to determine its next destination. However, I suspect a potential congestion and possibly a retreat to its moving averages before heading higher.

the interesting part however, is the JPY.
Fig 2. USDJPY weekly chart

While Nikkei was on the rise, JPY continued to weaken against the USD. What does this mean?

It is really a question that I ponder because I am quite unsure. To me it is likely a sign of fund exiting the market cashing out utilizing the gain from Japanese stocks.

While Nikkei is seemingly reaching its objectives, the decline of JPY against USD has not.

It is only close to reaching its 61.8% of its expansion at 144.841 from its double bottom formation. It has also crossed its 127% projection at 143.176

If this trend continue, I will see resistances between145.4207 to 149.7654.

Is this normal?

To be more certain, it is good to conduct a comparison between JPY and Nikkei.


Fig 3. Nikkei - JPY comparison

Based on the chart in Fig 3, I noted relatively normal behavior of JPY - Nikkei relationship, until early 2022. while Nikkei seemingly still in congestion band, JPY strengthened against USD, which could be indication that fund being pumped into the market. 

However, when Nikkei began to surge by 2023, JPY started to decline against USD. This as I see is possibility of funds leaving the market as demand of JPY is on the reduction.

I suspect the Japan market is in process of distribution. 

However, I must make it clear here, this is only my speculation based on what I see from the chart. 


Labels: , ,

4/09/2023

Currencies April 2023 update

Time passes very quickly, it seemed that we just celebrated new year, then Chinese New Year, the passing of my father and now we are into the second quarter of the year. May be I am getting much older now?

anyway, I have recently rekindled an old hobby of mine, I am now back into comic drawing. Drawing has been an important part of my life since I got to know the world. My first drawings were on the wall in my grandmother's room, a fish, or part of it. 

My uncles were in school at the time, and they were studying Biology, I managed a glance of the human organs in particular the digestive system. I drew a fish with the human digestive system as a result.

It was through years of work life that I started to lose my ability in drawing, the longer I was in the work force, the less imagination I have. So much so that I held a pencil in mt hand, a piece of paper in front of me, and it went blank for hours.

My flame in drawing grew recently when I found interest in perfecting my sketches of the female anatomy. Yes, I love drawing female, why? I remember one artist said when he was asked the question," because I love women."

anyway, at this point of time, it is not about women, or my sketches. Let's check on the sketchings of the charts.

I have recently heard from a youtuber that the US politicians were focusing on the wrong thing such as woke culture and "inclusivity" when the true problem is the decline of the USD.

The USD decline was mentioned often. However, It is recently facing more threat than before, with news that the Saudi and China going to trade oil using CNY, and that China's influence growing stronger to the extend that it initiated a peace talk between Saudi and Iran. Further more, an increasing number of countries are joining BRICS, a coalition to counter the strength of USD.

 I did an up-date on USD in April 2023 titled Currencies March 2023 update, While there were signs of upward reversal, I was uncertain on a few pairings. A month has past now, how is the USD doing right now?

Fig 1. SGD weekly chart

SGD did not go into correction. 

At this point of time, it failed to break through the 21-week moving average. Moreover, the point which it reversed coincided with the 61.8% projection level support of a major move. I figure that it will head towards its next level of support (100% projection). 

While hesitating at this moment, it nevertheless resisted by the 8-week moving average, it is indicative that USD will slide lower against SGD. 

During its last low, the counter did not touch its 100% projection support before its debounce, I suspect it will not stop at 100% mark and move further towards its 127% projection support at 1.26.

The correction upward has also generated another projection measurement. Its 61.8% projection support coincidentally is near the 127% projection level at 1.2679.


Fig 2. JPY weekly chart

Similar to SGD, JPY has also fell of after its correction upward. It is presently supported by its 55-week moving average. However, it also seems to lack inertia to reverse upward, giving me a feeling that it is congesting for a flag formation. 

It is however, floating above the 55-week moving average, which coincidentally at its 38.2% retracement support.

I am still uncertain of its trend at the moment. So I head back to a bigger picture.

As long as there is no violation of its formation, I will still consider its trend to head downward with support at between 113.220 to 122.59. If it is heading up, it will face its Bollinger resistance at 140.28

Fig 3. EURUSD weekly chart

I am using the chart on my trading platform as it has more Fibonacci tools than finance.yahoo.com. However, it only provides EURUSD pair and not the other way round.

EURUSD is presently retesting its previous high, coincidentally meeting the 144-week moving average resistance. It has not yet violated the old high.

For the time being, the formation gives me 2 possibilities: Support of between 0.8224 to 0.9308; Resistance of between 1.1436 to 1.2022.


Fig 4. GBPUSD weekly chart

Unlike EURUSD, GBPUSD chart looks rougher, probably because of BREXT and its present political turmoil. Of the 2, GBP seems weaker than EUR.

The general trend of GBP is down against USD, even with the recent up-surge, the present measurement unable to see it breach the previous high of 1.4242, with resistance between 1.3104 to 1.3903.

On the downside, there are 2 sets of measurements, a more recent one with up to 127% projection support of 1.04967, which has been tested before reversing up. The other with support between 1.190 (which has been crossed) and 0.9223. 

Some time it is sad to see such powerful nation goes into deterioration simply because self centered politicians who are good in speech yet incompetence in running the country. They ride on the band wagon of woke culture not because they believe in its cause, but it guarantees their own political survival. 

Going through world history, it is not difficult to see that an empire is reaching its death bed when the focus of the government is not focusing on the big issue to bring the country to the next level, but to focus on insignificant issues that do not even affect the country progress in any way. 

When the west is focus on avoiding hurting feelings of a certain people, they will lock themselves in a shell and shrink while other grow. 


Labels: , , , , ,

3/05/2023

Currencies March 2023 update

It was February 4th that I did an update on currencies titled Is USD on free fall? USD was seemingly at on a free fall the time. However, I also ignored the fact that the currency pairs were all in process of crossing the moving average belt, making it tougher for the counters to cross through.

In fact, the moving average belt seems to reverse the trend for USD.

Fig SGD weekly chart

In my last update, it was noted that SGD was close to its 100% projection support. Reversal happened since then. The upthrust of SGD is as strong as its downslide earlier, with similar steepness in the opposite direction.
Are we seeing USD strengthening against SGD? 

It might still be too early to tell. At the end of this week, its ascension is blocked by the 21-week moving average, producing a hang man candle stick. While so, the pattern does not look spectacular.

Another interesting thing on the chart is the MACD which has just crossed from the bottom. It is possible to be an indication of reversal. 

My suspicion is that it might go into a correction after this.

Fig 2. JPY weekly chart

Similarity is observed on JPY, except that JPY has broken through and stayed above the moving averages. There is a higher chance that USD will continue to strengthen against JPY from here on.

JPY is presently resisted by its 38.2% retracement line at 136.68. If broken, the next level is its 61.8% retracement at 142.58.

A point to note is the crossing of MACD, a similar situation to SGD.
  
Fig 3. EUR weekly chart

EUR is weaker than JPY, going against USD. It is presently stopped by its 21-week moving average. Nevertheless, it is presently on borderline support of 55-week moving average. 

Like both JPY and SGD, its MACD has also crossed from the bottom. It is more likely that the direction is still up for the time being.

Using retracement, the likely resistance level lies between 0.9611 to 0.9944.
Fig 4. GBP weekly chart


GBP is more interesting here. It seems to be in a rectangle formation. Unlike EUR, it did not break to a lower low, and reversed on reaching the previous low. As such there are 2 possibilities. 

If it breaks the upper boundary, then we are seeing an objective of 0.8848. If breaking the lower boundary on the other hand, the objective will be 0.7623.


Labels: , , ,

2/04/2023

Is USD on free fall?

After my last entry Why oil price went up?, I noted USD weakening against SGD, it made me wonder how it is performing against other currencies.

Fig 1. JPY weekly chart

How shall I say this?

Compare to JPY, USD seems to be on a free fall. This is a spike reversal although the the peak bar did not exhibit a single bar (or shooting star candlestick) or 2-bar reversal.

While it fell through 55-week moving average in January 2023 and remained below till now, it nevertheless seems to be losing momentum.

I feel that it is possible that a correction might be in range. However, its 8-week moving average is in process of crossing the 55-week's, we might need to wait a little longer, probably until the 21-week reaching 55-week moving average.

I do not really have any projection read for the time being. So based on the retracement measurement, support level is at about 120.76 to 126.96.


Fig 2. EUR weekly chart

Similar to JPY, USD is also on an apparent free fall against EUR. However, there are more pauses for EUR, making it looks like EUR is with a 5-wave down.

The 8-week moving average has already crossed 55-week's and it is about to reach 89-week's. EUR even crossed the 144-week moving average this week and closed below it. It will be interesting to see if 144-week moving average can continue to resist the counter from going back up.

Using projection, the next support levels are between 0.8584 to 0.8948. At the same time, EUR is about to reach its 61.8% retracement support at 0.9005.


Fig 3. GBP weekly chart

Just looking at the chart, do I need to say more about GBP?

Yes, there is something to say. GBP seems to be the weakest of the 3 currencies. While the other 2 breaking the 55-week moving average, GBP was actually first supported by its 55-week moving average before breaking through the second time. 

In fact, the moving averages support for GBP is stronger than that of EUR. As such, can I say that Europe's economy is presently stronger than UK and that the UK market is less attractive to the investers?

Using projection measurement, I can see support at between 0.7522 to 0.7874, coincidentally its 144-week moving average position at the moment.

GBP is again congestion after crossing the 55-week moving average. Making a potential set up for another projection measurement. However, the set-up is incomplete, so I won't be doing the measurement for this just yet.

In my last up-date on USD in Federal reserve considering slowing down of rate rise...., I have estimated USD would continue to weaken against other currencies. Looking back that entry, the few counters here is either near or have reached the objectives set. 

I am not boasting about my skill set here as there is little skill set needed to set up measurement based on Fibonacci retracement and projection. I am concerned. 

USD is actually on some kind of free fall after reaching its peak. If I am to use a metaphore on this, I can only bring in the Super Nova, the final burst of a dying star. It is possible that people are dumping USD! Considering the recklessness of the US politicians taking for granted the world dependency on its currency. I believe that they have not even noticed potential danger ahead of them. 

That this point of time, they are still thinking of rising the debt ceiling and taking the easy way out instead of cutting spending. What will happen should USD reach the next level or even lower?

Devaluation of USD can lead to inflation or even hyper-inflation. By then USA will be heading for hardship, worst still, it is bring the world along.


Labels: , ,

12/24/2022

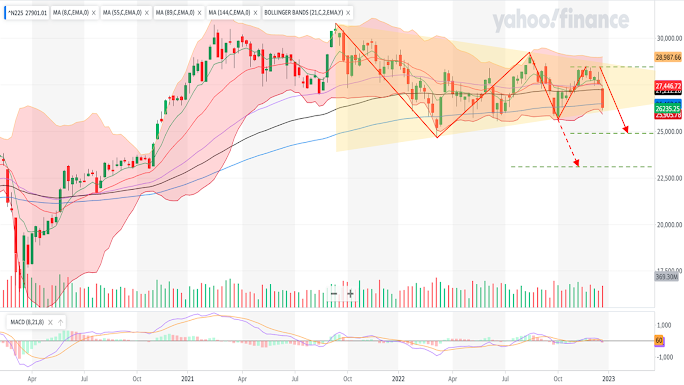
A plunge in Nikkei 225 this week


I have decided to include this entry this week. In my last up-date on Nikkei 225 in After a week's break...... I was still positive on this counter while it was barely supported by the moving averages. It however, surprised the world with a plunged of over 900 points on Tuesday, 20thDecember 2022.

To be frank, I was happily trading this counter in the morning and moved away by 9:00AM. That was part of my strategy. It really took me by surprise when I checked on the market status by 3:00PM. but I do not regret not capturing this plunge, becaussse it is not part of my strategy.

It is due to a surprise move by Bank of Japan to consider relaxing the the tight limit set on their bond yield, leading to possibility of increase in interest rate in future. The move caught the market off guard and thus resulting in the Tuesday's plunge.


Fig 1. Nikkei 225 weekly chart

By the end of the week, Nikkei actually broke as stayed below the 144-week moving average. I estimate that the counter may try to reverse up in the coming week, but may be kept below the belt by the end of the coming week. If this is so, we will see continuation down trend.

Another observation is that Nikkei seems to be in a triangle formation. It has not been broken yet, therefore I will not use this as a gauge for measurement. 

There are 2 formations that enable me to use projection to estimate its support levels. The  first makes use of the top of the major trend and counter trend. However, the down trend here with a gradual slope and to it is not a very good indication for trend reversal confirmation. Giving me a sense that the whole thing might be a counter trend itself.

The support level using projection is between 23,108 to 25,443. 

Base on the more recent fluctuation on the other hand, I can see the more immediate support levels. It surpassed 26,276 and the next level is between 23,921 to 24,901.

If it reverses however,  it will be possible for Nikkei to surpass the previous major high.

What about its currency JPY? After all, interest rate affects currencies much more than others.


Fig 2. JPY weekly chart

Contrary to Nikkei, JPY actually strengthen against USD, meaning that the demand for JPY increased. I have spoken to my brother briefly, he is an accountant. He said it is logical, the demand for JPY and the drop in Nikkei is redirection of JPY for government bond.

What happened here is the drop of JPY (on the chart) is supported by its 55-week moving average, and the moving averages support remain intact.  It is possible a reversal might happen next week, IF  the bar next week tests but ends above the moving average.

For the time being, I will maintain the indication given by the counter. Using projection (again), I estimate the support be between 129.67 to 132.65.

Labels: , , ,

11/27/2022

Federal reserve considering slowing down of rate rise....


(Click photo for news link)

I have an entry last week about the possible weakening of USD titled Is USD weakening now? on 23rd November 2022, I only used SGD for comparison, partially because I stay in Singapore. The other was because I was a little tired, I have just travelled back from Malaysia, and I have not fully rejuvenated yet.

USD was at a crucial point of uncertainty as it reached a triple moving averages support level, making it difficult for USD to continue its downslide against SGD. Never-the-less, I placed my bet on eventual continuation due to its present set up, especially when it was resisted by the 55-week moving average.

On 24th of November 2022, news came out that there is a consensus to reduce the rate hike. By this time, USD has fallen quite a while. I noted the beginning of a fall in Interesting development in SGD...and I missed the entry point on SGDMYR on 6th Oct 2022 but at the time, I was uncertain. It was only on further development that I became more certain by 16th October 2022 in Monetary intervention on SGD and a case for the currency

EEnough about SGD, how are other currencies performing against USD?
Fig 1. Jpy weekly chart

Let's start off with JPY. The market was till panicking with JPY a while ago considering its steep fall against the USD. Apparently, the reversal came on 16th October 2022. It has so far tested 21-week moving average and now resisted by this moving average, it is possible that JPY will continue its journey to the next support level of 55-week moving average.

Using projection on this pause, I obtain a measurement of support between 131.199 to 135.41. Coincidentally it is close to where 55-week moving average presently lies, 131.24.  It is also close to the previous bottom of 130.41.

It is possible for me to use the top as one of the references, however, I will use a single sub-wave 3 for measurement. The chance of this objective reached is higher.

Fig 2 EUR weekly chart

EUR behaves in a similar way as that of JPY, except that it started a few weeks earlier than JPY on 25th September 2022. However, it is presently floating between 21 and 55-week moving averages.  

Same as JPY, I will use sub-wave 3 to be used for measurement. However, as it is afloat, it is possible that EUR might move towards 21-week moving average before going down further. 

Adopting projection, I obtain support between 0.9048 to 0.9327.  This range is coincidental with the 89 and 144-week moving average. However, it is my belief that 55-week moving average is prudent in many cases, as such I consider an additional support at 0.9506 for EUR decent.
Fig 3. GBP weekly chart

I did an entry on GBP in GBP s looking good..... earlier but I compared it to EUR. Comparing it with USD, let me feel that DBP is more aggressive than others. While JPY and EUR are pausing after a plunge, GBP has already broken through its congestive stage and on continuation downward. It is close to reaching the 55-week moving average as week speak.

Using projection, GBP has past its 61.8% projection support at 0.8315 and the next support level is 0.7917, by when reaching its 89-week moving average as well as its Bollinger band lower envelop. The possible support addition to these is the 55-week moving average of 0.8147.

So far we are seeing USD weakening against the few major international currencies. How is HKD doing then?
Fig 4. HKD weekly chart
Evience of HKD strengthening against USD only visible on 6th November 2022. This is due to HKD ceiling against USD preventing it from its natural development. I won't do much measurement until more development on this counter. As far as I am concern, it is only stopped  50% retracement, and by the end of the week stayed above the 144-week moving average.  

Gapping during the last 3 weeks of descent further demonstrate potential for further down slide. The only problem is that the weeks end with much recovery, indicating uncertainty in its descent. The moving averages also indicate that it may not be ready to go down just as yet. I suspect that there might be a correction on the way. 
Fig 5. CNY weekly chart

While HKD descended from brink of its limit, CNY has not, it was allowed to develop its pattern. 

The reversal of CNY came after 30th October 2022, much later than GBP and EUR. it has only broken through its 8-week moving average 2 weeks ago and stayed below this support turned resistance by the end of this week. 

However, I am pretty uncertain about this counter. while it is seemingly on a down trend, its bars are all positive. The counter can go either way.

At this moment, there are much uncertainty in this counter that I will refrain from establishing measurement. I will do this later. 


Labels: , , , ,

9/14/2022

The sudden plunge of indices last night and present status of currencies

 I was lazing at my station last night with the Dow Jones Chart turned on. I remember it was around 8:00PM plus (Singapore time). I was watching some video on Youtube.com when all the sudden I noticed a sudden plunge on Dow Jones 3-minute chart, it was exactly 8:30PM. 

I was taken aback with the sharp descend. While I faithfully follow the principle of technical analysis which discount any fundamentals, I can't help but to think, " what happened?"  

I quickly check on other indices and I found similar situation even on Nikkei and Hang Seng. I even checked on the German index DAX and the same thing happened, there must be an event that shook the market.


Fig 1. Nikkei225, Hang Seng and Dow Jones 3-minute chart

Turn out there is a Fed report that while the rate was raised, inflation in August was above expectation at 8.3%, rose by 0.1% compared to previous month.

Anyway, as I have said, I was lazing. I was too tired to do anything about it, Furthermore, this may lead to congestion, and I was not really keen on Dow Jones as it means mid night trading for me.

As for today, my main intention is on currencies as there has been much hype about weakening currencies. Already many experts have been telling people that it is not the weakening of the currencies of their countries, it is the strengthening of USD. This was also what I mentioned in What is USD doing?

I will focus on 3 currencies today to determine where they go: JPY, EUR and GBP. Even though technical analysis supposed to enable quick analysis, it does take time to analyze each chart.

Let's start with JPY since there is so much warning from youtube.com videos that JPY is very weak against USD even though it is known as a safe haven currency. 


Fig 2. JPY weekly chart

Based on my interpretation, there are 2 zig zag patterns and, in a way, form a double bottom, so there are 3 measurements. In the long run (blue zig zag), it has already crossed the 61.8% projection at 136 and heading to 146. 

we can ignore the other zig zag as well as the double bottom. The objectives were much lower and surpass.  

Breaking146, the next level of resistance is 159. Will it go further than that? Possible, but let's focus on the more immediate ones first.

Let's move on to EUR.


Fig 3. EUR weekly chart

Interesting enough, there are also 2 zig zags and one double bottom (more like a triangle). 

With the longer-term zig zag (in blue), it has already past the 61.8% projection at 0.9505, the next level of resistance is the 100% projection at 1.046 and 127% projection at 1.114.

 As for the double bottom (or triangle), the resistance is even further at 1.082.

As for the smaller zig zag (in green), the next level off resistance is 161.8% projection at 1.041.

So 1.04+ is really one level to watch out for.

Finally, let's move on to the last currency of this entry, GBP.


Fig 3. GBP weekly chart

Unlike the other 2, GBP lacks the formation of double bottom (or triangle). There are only 2 zig zags that I can measure with projection.

Using the longer-term zig zag (in blue), the 100% projection resistance at 0.948 while 127% at 1.0165.

The more immediate set up on the other hand, resistance at 100% projection is 0.877 while 127% at 0.9246.

While the oil price is kind of stabilized in US, it is because of a stronger USD. For other countries however, we will continue to see higher prices on oil, unfortunately.


Labels: , , , , ,

4/20/2022

What's with USDJPY and where is theading?

 With the re-opening of the border, I took the opportunity to drive back to Kuala Lumper last week to visit my parents. 

I don't go home often as I have chosen Singapore as my more permanent home. Eveery time home, I will do my best to spend more time with my folks and bring them around and enjoy some good food. Tour is no longer an option considering their age, even crossing state is a challenge. 

As a result, I am late on my entry.

I did an entry on USD earlier indicating its strengthening aginst other currencies. In my last entry, I did a more detail analysis on EUR and GBP against USD. However, I hesitated on JPY.  Unlike other currencies, USD is on a run away surge against JPY. 

I changed my mind this week. It is still worth checking up on. So what is happening on JPY?

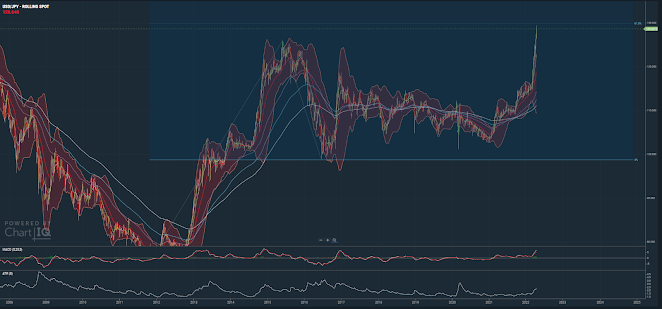
Fig. 1 USDJPYweekly chart 2016 - 2022

Let's first look at the range between 2016 to 2022. It is quite clear here that USDJPY is completing a Zig Zag move, using projection, it crossed its 127% projection mark. However, it thus far have not indication of reversal. 

With its congestion stretching from 2017 to 2020 horizontally, The burst will have to travel a similar stretch vertically. 

Then is there any other indication of resistances in its path?

Fig. 2 USDJPYweekly chart 2012 - 2022

We are now moving further back in time to 2012, It can be seen with a steep ascension prior to its correction by mid 2015. The drop between 2015 to mid 2016 provide a projection measurement. Here we are seeing USDJPY is reaching its 61.8% projection. This resistance level in my experience marks a correction phase after its escalation. The next resistance is 149.302. Is there any support level at this moment? 

I am not very sure as the the moving averages are also at a steep climb, If I am to watch out for would be its 55-weeek moving average. So what else am I seeing on this chart?

Fig. 2 USDJPYweekly chart 2002 - 2022

Moving further back in time to 2002, it is interesting to note the formation of a reverse head and shoulder, What's more alarming? 

It's recent surge has broken the neck line of this formation, meaning a chance for it to reach  176.35! Can this even be possible?

It is a possibility, but it is also possibly be much further in the future. The more pressing objective is to determine the most immediate resistance level. So where should we be setting alarm for JPY?

I can find 2 levels,130and 149.

130 is the 61.8% projection resistance and with such steep climb, there is a chance that a correction is around the corner. 

149 is not only that this is the 100% projection  level, it is also a reversal point in the year of 1998. 

While 149 is quite far away, 130 is likely to be reached either this or next week. It is worthwhile to maintain close observation at this point for one who trade in this currency.

Labels:

3/13/2022

What is USD doing?

 While the war between Ukraine and Russia is on-going this week, there as been little change so far on the direction of the few indices that I was focusing on, they are still on the way down. 

This made me wonder how the currencies are doing right now, in particular SGD?

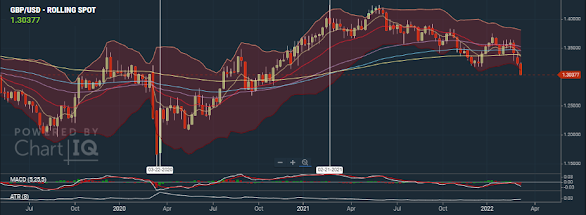
Fig 1 GBPUSD weekly chart
Fig 2 EURUSD weekly chart
Fig 3 USDJPY weekly chart
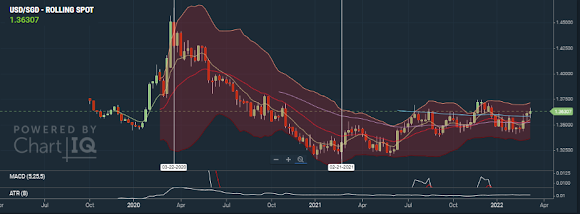
Fig 4 USDSGD weekly chart

Not that I am spending a lot of time and effort in analyzing individual charts, I observed one common behavior from these charts.

USD is getting stronger. This can be seen from both EUR and GBP weakening against USD while USD strengthening itself against JPY and SGD. Imagine that! After printing so much money USD actually become stronger?

It is also interesting to note that USD strengthening itself against both Asian currencies  since 3rd January 2021 while it was not until 21st Febuary 2021 that the 2 European currencies weakening against USD. Yes, it is 2021 and not 2022, it is not the Ukraine-Russia warfare that cause this. 

The strengthening of USD against EUR and JPY is more serious than GBP and SGD, Its rise against GBP and SGD is more gradual, both are either breaking through or just broken and retested the moving averages.. EUR and JPY on the other hand have their trend set since last year (March 2021 for JPY and Oct 2021 for EUR).

Among the currencies, is there any that are strong against USD?

Fig 5 AUD andd NZD weekly chart

I am placing these 2 charts side by side because they look like twins. Both counters actually weakened against USD at the same time as EUR and GBP , on 21st February 2021. However, both descents stopped on the week of 30st January 2022 and has been climbing since then. 

They are both testing multiple moving averages at  this point of time. From the looks of it, it is possible that they ill continue to rise against USD in the near future. What cause me o conclude as such?

I am looking at the behavior of its higher time frame moving averages, they do not seem to be interested in crossing while converging on each other. So even if they cross, it is likely that the crosses are weak. Further more, there seems to have more momentum for these 2  chaps to move further up.

Nevertheless, we might see both counters to draw back a little before moving forward.


Labels: , , , , ,