Wave C?
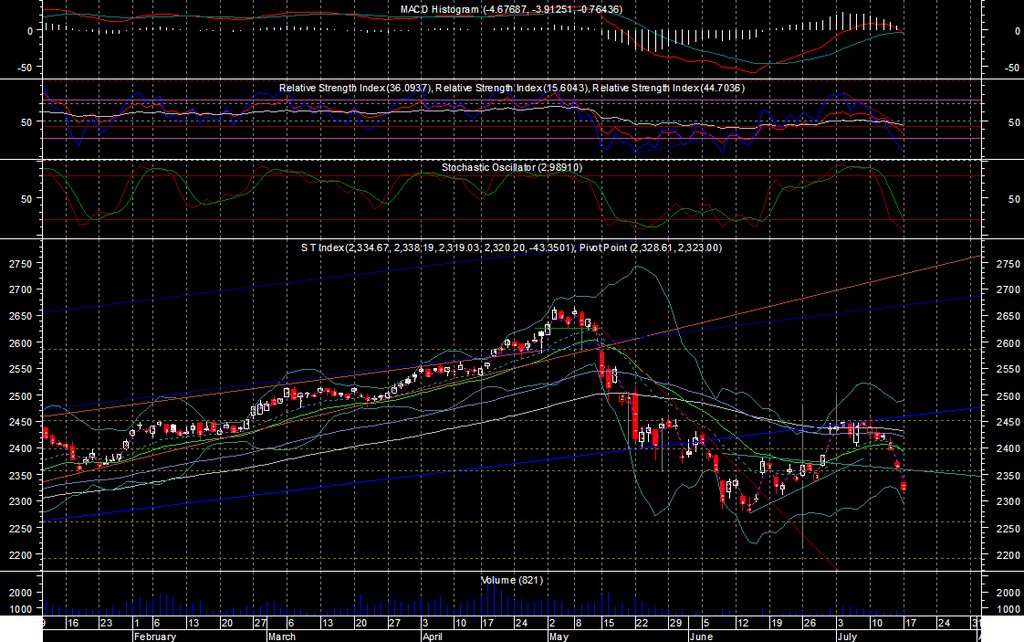 Fig 1 STI Daily Chart
I was quite positive with STI after seeing the triangle formation. I was expecting that it should at least be reaching somewhere between 2,480-2,500. Unfortunately the subsequent formation did not manage to perform as I have expected. Top trader was less optimistic than me and estimated a lower target at aro 2,450. It seems like he is more accurate this time round.
The present formation actually looks interesting. If the initial drop has been an A wave, the rebound is B. With standard calculation, B suppose to be 0.618 of A @2,517, with ratio of 0.4589. Seems like not all stops follows Fibonacci number. However, it is useful as a guideline. If we consider that B wave is completed, then we are now seeing C wave. Using Fibonacci guideline again, the target should now be 2,217.
Both indicators that I am using, RSI and Stochastic are at the bottom. However, it does not mean that reversal be in sight. There are many times when the indicators at the bottom and stay down. This is especially true when a chart is on down trend. So there is a high chance that the indicators stays down, leading the STI to move south.
With the STI moving south, the next support that I see is 2,270 while channel support @ 2,295. Resistance is now 2,355.
posted by denzuko1 @ 12:29 AM
![]()
![]()

0 Comments:
Post a Comment
<< Home