Weakness, weakness, weakness....
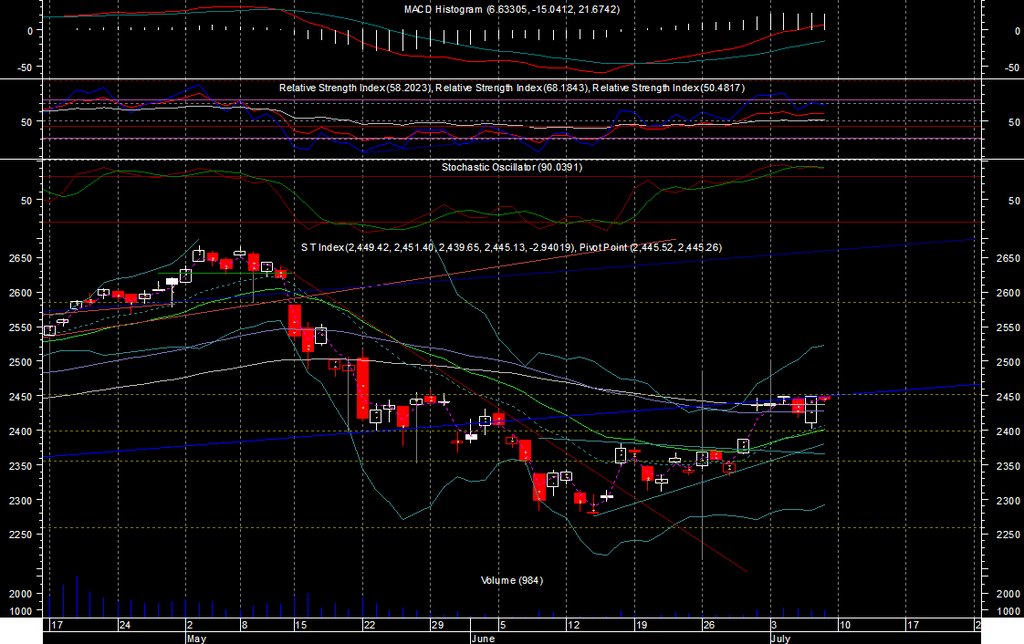
Fig 1. STI Daily Chart
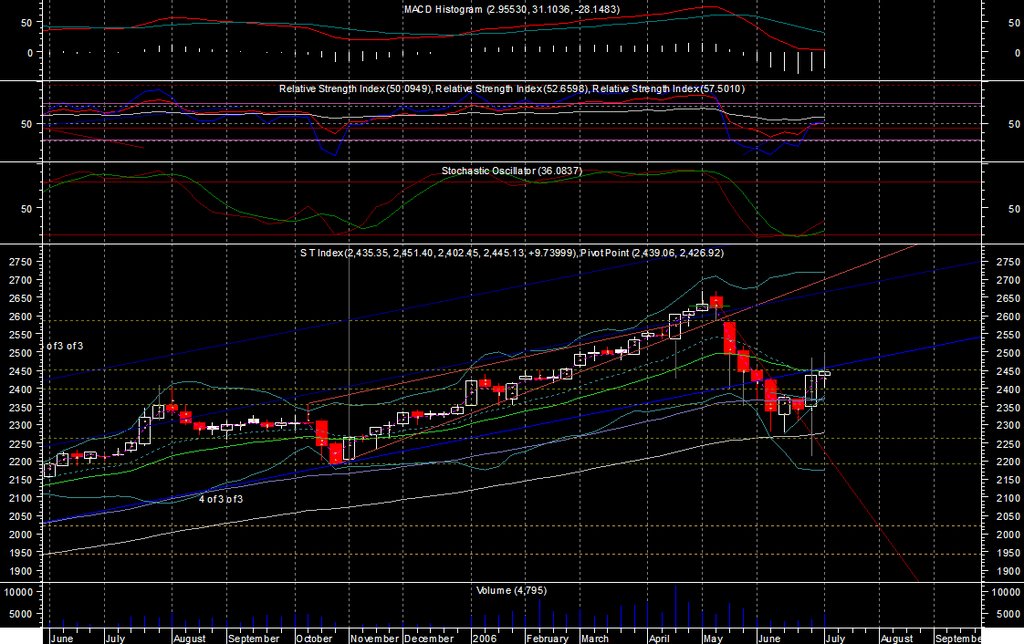
Fig 2. STI Weekly Chart
I was looking at the STI charts, both weekly and daily.
The weekly is a little confusing to me, both RSI and Stochastic are moving up, indicating that the STI is gathering momentum upward. At the same time, it formed a hangman which tells people it is going down. From weekly point of view, the direction is now unclear and need the next week to confirm.
The daily chart is a little more scary. STI and Stochastic has formed a divergence with STI. It is a foretale sign that the chart is going to head south. Further more, if failed to break 2,451 and now is pressed by the 21 days EMA @2,449. With the daily chart, I am seeing south for STI. Combining with the weekly chart, the coming week should be red.
At present the support level is 2,398, 2,355.Resistance @ 2,451,
posted by denzuko1 @ 11:13 PM
![]()
![]()

4 Comments:
STI rebound may have entered terminal stage. Tg1 2450 rebounding 38.2% had achieved, next tg is 2473 rebounding 50%, which is likely the maximum value STI can go in this bear rally or sucker rally. No much to gain even if STI does reach 2473. Indeed, it is high time to exit long positions at current level. I myself have exited everything except Ausgroup and Kian Ann. I have achieved and exceeded my tg - 50% rebound of loss of paper profit. That's quite enough!
After all, there will be plenty of opportunities next time once a firm bottom is in sight. Like before, I can always pinpoint the bottom, big or small, long term or short term. No point to play with the potential mighty bear.
quite right there, its a fact that this is definitely a suckers rally, the rise is not accompannied by volume, therefore its not very convincing. I was targetting a little more tho, then again my take is STI will trace a higher bottom, very bullish for averaging down if u have holding power. juz muy 2c.
I never do an averaging down, it's not a good strategy. Charts can talk and tell us when it's time to buy. I'll buy heavily if it's time to buy.
Denzuko,
May I suggest that you add volumes in your index chart since they are so omportant?
Regards,
Toptrader
Post a Comment
<< Home