Google
 
Web thoughts-denzuko1.blogspot.com

My Charting Blog

It is interesting that I start off this Blog when the Singapore Stock Market is heading south. However, this makes it more interesting for me to write on as the market turned volatile. My interest is Technical Analysis, TA for short. I love to look at charts and predicting where they are heading. This blog is or me to record my thoughts on the market. The articles on this blog are based solely on my personal opinion on the charts that I read and readers should not take it as absolute.

5/01/2023

Tucker and Fox

 It is first of May today, what does it mean?

Public holiday! It is also rare that this public holiday is shared by the whole world, very like the lock down of Covid-19 (Wuhan virus pandemic).

Most of us understand this is known as labour day, except for United Kingdom (UK) and probably any country with a political party with name Labour on it. While I was studying in UK, I got to know that it was called May Day.

While we all believe that it is a celebration and appreciation of the working people, it is little known fact that Labour Day is actually a Socialist Movement,  One interesting fact is that the first Labor Day was declare to be on first week of September  in 1894, in the US of A and not Europe! 

A Haymarket Riot happened between labour group against the authority in Chicago started first May 1886 and lasted for days. A bomb was set off on May fourth, killing 7 officers and 8 civilians.

The event inspired the socialists years later in Paris who declared May Day a holiday to honor the workers' rights.

workers went on protest again in May 1894 against the 16-hour work days with low pay at Pullman Palace Car Company. the protest was joined by the American Railway Union (ARU), resulted in crippling of country's rail traffic.

While the then president Grover Cleveland signed into law declaring Labor day as a national holiday, he sent troops to Chicago to end the boycott. the troops shot into the crowd killing dozens of people.

For more information on Labor day and May Day, you may check out The History of Labor Day (investopedia.com) which I got this information from.

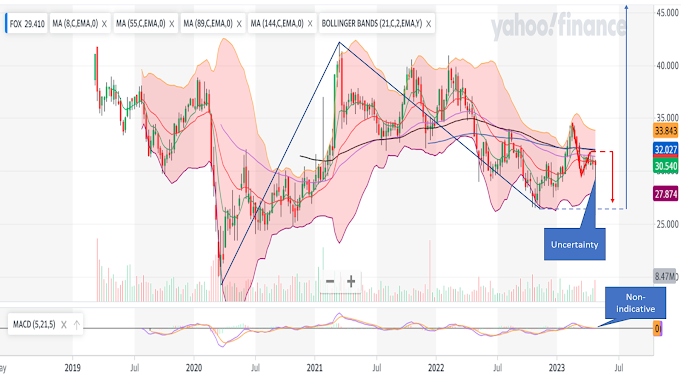
As for today, it is a little early to revisit the indices and forex. I am feeling more like Fox.

It was on the news on Monday that Fox terminated its contract with Tucker Carlson, a conservative commentator with very high viewership. Much speculation as a result as to why the termination, including the conspiracy around Fox's settlement with Dominion. 

Naturally, the stock tumbled with news of Fox terminating its top rating show host, and some used its stock plunge to claim the amount of damages Fox incurred.

This got me interested in this counter. 

Fig 1. Fox Corp weekly chart

It is interesting at first glance that Fox is SO CHEAP compare Twiter and Facebook. Even Netflix price is much higher than Fox. It is quite obvious that market deem the importance of broadcasting is diminishing with the rise of small independent content creators.  

The pattern of the chart looks to me like in a counter down trend and poise to move upward, especially when recent peak in August 2022 superseded the previous high. It only retreated back below the moving averages and retesting the resistances in its recent moves. Nevertheless, it continued to be held down by the 55-week moving average and by the time Tucker was fired, it broke the low of March 2023.

Even though it tried to recover from its plunge, it failed to break upward and closed in red below both 8 and 21-week moving average.

From this chart, there are 2 reading that I am interested in: a major move and a minor one. he

In a major move, it has potential to head higher to between 40.57 to 49.36.

In a more minor move on the other hand, it may head lower to between 26.95 to 28.79.

One thing to point out here though, the week's bar is indicating market uncertainty, meaning that the market is unsure about the effect of the termination. My suspicion is due to it congestion behavior at the moving average. 

It may be good then to look at its lower time frame.

Fig 2. Fox Corp daily chart

Looking at its daily chart, fox is attempting to recover from its plunge. While there is a momentum upward, it is presently resisted by its higher moving averages. While there is a potential crossing from MACD, it has just gone below neutrality level. 

I suspect that it may test the higher moving averages in the coming week while the main trend remains to be downward.

I was working with my son on a study of the CN tower of Toronto and part of the content was to discussed the future of communication tower, which primarily is meant for broadcasting.

It seems that there are multiple threats to broadcasting business especially with the advancement of the internet and the Cambrian explosion of content creator. there will come a time when the content creators will meet an extinction phase, the move still spell bad to broadcasting services, which I believe is on a sunset stretch unless they re-invent themselves.


Labels: , , , ,

0 Comments:

Post a Comment

<< Home