A plunge in Nikkei 225 this week
To be frank, I was happily trading this counter in the morning and moved away by 9:00AM. That was part of my strategy. It really took me by surprise when I checked on the market status by 3:00PM. but I do not regret not capturing this plunge, becaussse it is not part of my strategy.
It is due to a surprise move by Bank of Japan to consider relaxing the the tight limit set on their bond yield, leading to possibility of increase in interest rate in future. The move caught the market off guard and thus resulting in the Tuesday's plunge.
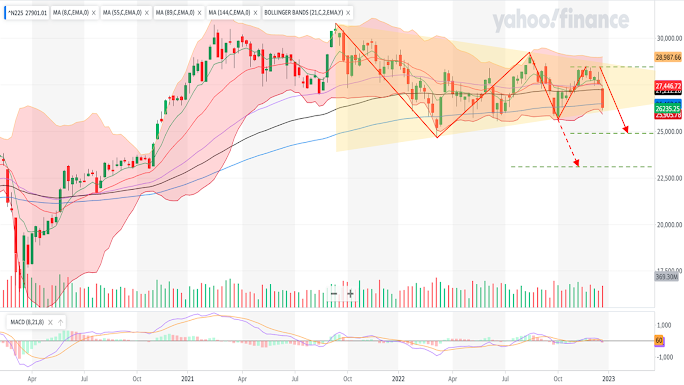
Fig 1. Nikkei 225 weekly chart
By the end of the week, Nikkei actually broke as stayed below the 144-week moving average. I estimate that the counter may try to reverse up in the coming week, but may be kept below the belt by the end of the coming week. If this is so, we will see continuation down trend.
Another observation is that Nikkei seems to be in a triangle formation. It has not been broken yet, therefore I will not use this as a gauge for measurement.
There are 2 formations that enable me to use projection to estimate its support levels. The first makes use of the top of the major trend and counter trend. However, the down trend here with a gradual slope and to it is not a very good indication for trend reversal confirmation. Giving me a sense that the whole thing might be a counter trend itself.
The support level using projection is between 23,108 to 25,443.
Base on the more recent fluctuation on the other hand, I can see the more immediate support levels. It surpassed 26,276 and the next level is between 23,921 to 24,901.
If it reverses however, it will be possible for Nikkei to surpass the previous major high.
What about its currency JPY? After all, interest rate affects currencies much more than others.

Labels: JPY, N225, Nikkei, Nikkei 225
posted by denzuko1 @ 4:08 PM
![]()
![]()


0 Comments:
Post a Comment
<< Home