Google
 
Web thoughts-denzuko1.blogspot.com

My Charting Blog

It is interesting that I start off this Blog when the Singapore Stock Market is heading south. However, this makes it more interesting for me to write on as the market turned volatile. My interest is Technical Analysis, TA for short. I love to look at charts and predicting where they are heading. This blog is or me to record my thoughts on the market. The articles on this blog are based solely on my personal opinion on the charts that I read and readers should not take it as absolute.

10/12/2025

Interesting Nikkei behavior

Japan has a new prime minister last weekend. 

The Shigeru Ishiba resigned as the prime minister following major electoral defeats of the LDP-Komeito coalition. This followed with an LDP presidential election with Sanae Takaichi won. 

As a result, she became the first female prime minister of Japan. On appearance, Sanae Takaichi is more conservative with Japan's interest come first. Her mindset seems to be similar to that of Trump, except that she is more protectionist in area of immigration.

well, I did not take much note of it and went on minding my own business, after all, it was weekend!

It was to my surprise on Monday morning that Nikkei 225 actually opened with a 2,000 points gapped up! 

However, it only went mildly upward before deteriorating throughout the week, losing every single point gain from gap up.

It is common for a counter to try recover a gap before continuation. However, attention is really needed if the gap is fully covered, it indicates weakness in the direction. Is Nikkei in possible reversal?


Fig 1. Nikkei weekly chart

My last up-date on Nikkei was Let's have an up-date.. in April 2025. I believed at that time that Nikkei should be on continuation downward. 

Nikkei did not, reversed and even breaking the previous high. 

At present, it managed to reach the 100% projection resistance of a major move. 

I believe it is going to correct in the coming weeks, but it may not be ready for reversal just yet.

Reason?

There is not yet evidence of divergence for Nikkei on the MACD. Even though there is a potential sign of MACD crossing at this point of time, it is still in the positive zone, except that its momentum is getting weaker.

Where lies the support then?

I will use its 55-week moving average as reference for its support, which is 39,814.

Should there be break through on the upside however, I believe its 127% projection of 53,044 will be its next resistance.


Labels: , ,

6/01/2024

Is Nikkei firm on continuation downward?

In my last update on Nikkei "Is Nikkei beginning it's descend?" dated 20th April 2024,I estimated that Nikkei is likely to correct before continuation on its descent as its descent at the time was supported by its 21-week moving average. 

Since then, Nikkei indeed corrected until this week, when it tests its 8-week moving average only to retreat by the end of the week, creating a potential hammer candlestick.

Does it mean Nikkei is going to continue its journey downward from now?

Fig 1. Nikkei weekly chart

Let's start with the gradient of its uptrend, which is very steep, it indicates momentum upward prior to its descent. It follows by the hammer this week which Nikkei fails to break through, giving me impression that there is some weakness in its fall. It is possible that Nikkei is presently correcting and will head higher after that.

The next question is whether Nikkei has completed its correction or there are more down side?

While supported by both its 8 and 21-week moving average this week, I believe that it will retest these supports before heading down towards its 55-week moving average, which coincide with the 100% projection support presently at 35,077. 

What if I am wrong?

Then we will see its resistance at the Bollinger envelop at 40,772, which also coincide with its 127% projection resistance.

The thing is that Nikkei has already crossed the 100% projection resistance of a major move and there is limited upside. The chance of it heading downward is higher. 

Will it break 55-week moving average and make its descent more permanent?

That will depend on it momentum in its next phase.


Labels: , ,

4/20/2024

Is Nikkei beginning it's descend?

I touched on Dow Jones again last week noting its gain in momentum for descend, which leads me to look into other indices more related to me. 

So I will concentrate on Nikkei 225 this week.

The last time I checked on Nikkei225 was on the last day of year 2023, when I did a year end review of the 3 main indices and recorded in Year End Review of Dow Jones, Nikkei and Hang Seng dated 31st December 2023.

I used the monthly chart then for my analysis to enable a farther vision of the counter.  I was with an opinion that Nikkei should be rising up with resistance observed between 35,500 to 38,500. 

Since then, I have not touched on Nikkei over its higher time frame, since the time frame I used (3 minutes chart) for my trading is too far from the higher time frames to be affected.

It takes a long time for a 3-minute chart to reach the next resistance / support level on a monthly or even weekly chart. Even when reaching the said levels, it fluctuates in such wide dynamic range.

In short, daily chart is useful enough for movement prediction.


Fig 2. Nikkei weekly chart

Since my last read, Nikkei has broken through the resistance levels that I have highlighted, reaching a high of 41,124 before retreating. This also coincide with the 100% projection resistance of its major move. 

Its descend is with momentum, breaking through the 8-week moving average after a short pause. It also broke through and stayed beliow its 21-week moving average. 

I suspect it will either congest or correct in the coming week, but will descend further there after.\

55-week moving average will be the crucial point for Nikkei, since it also coincide with the 61.8% retracement line at 34,396 and 61.8% projection line 33,655. 

It is also interesting to note that there is a divergence on MACD, even though it is a minor one. There is a need for more divergence signal for more certainty. 

In addition, its upward movement seems to follow a 3-wave behavior, giving me the impression that this is a counter wave.

This counter needs to be monitor closely to determine if Nikkei is indeed reversing. 

Labels: , ,

11/04/2023

Nikkei moved!

My last update on Nikkei was on Dow Jones, Nikkei and Hang Seng Up-date 1st Oct 2023. I maintained at the time that Nikkei was in a counter wave with a possible support at 55-week moving average.

This week, the low of Nikkei is at 30,388 while 55-week moving average was 30,359. It did not really touch but they were close. At the same time, I also mentioned of another support level of 30,868. This is the 100% projection support of the counter wave.

The upthrust this week is decisive crossing the previous high of 32,660 reaching a height of 32,827 closing at 32,747.

Are we seeing a continuation that I have been expecting?


Fig 1. Nikkei weekly chart

Considering a steep slope heading north while a gentle one downward, I was anticipating a continuation after a 3-wave correction. 
However, it seems that the upthrust this week is stopped by at minor 100% projection resistance created by a pull back after a seemingly reversal bar. I suspect that it may lead to a short correction ( 1 to 2 bars) before continuation. 
The next level of resistance will be 33,425. 
Why I think so?
This level coincides the 127% projection with the present level of Bollinger band.

Thereafter, Nikkei will challenge the resistance zone between 35,532 to 39,156, the later would be the 100% projection level of a major move. The objective will not be achieved in the near future though, it is a major move and there may still be lots of factors influencing its climb. 
Let us continue to monitor its progress.


Labels: ,

6/25/2023

Nikkei & JPY divergence

I was pretty aimless this week, a little unsure what I should discuss for this week's entry. 

While going through the forex pairs, I noted something interesting on JPY.

As I mentioned in Nikkei run away surge on 20th May 2023, Nikkei was surging upward. Further to that I also mentioned in EUR GBP comparison on 6th May 2023, both GBP and EUR were strengthening against USD. I also noted in Occult always lead to eventual collapse on 17th June 2023 that it was USD weakening against major currencies.

With Nikkei continue its uptrend, I would expect JPY to be stronger against USD.

Fig 1. Nikkei weekly chart

Since my last update, Nikkei made further progress and has in fact reached its 100% expansion level, coincidentally the double bottom objective. It is also at 61.8% projection of a its major trend, while 161.8% projection of a minor trend.

This week, I saw Nikkei retreated from its resistances. However, a single bar of reversal requires more development to determine its next destination. However, I suspect a potential congestion and possibly a retreat to its moving averages before heading higher.

the interesting part however, is the JPY.
Fig 2. USDJPY weekly chart

While Nikkei was on the rise, JPY continued to weaken against the USD. What does this mean?

It is really a question that I ponder because I am quite unsure. To me it is likely a sign of fund exiting the market cashing out utilizing the gain from Japanese stocks.

While Nikkei is seemingly reaching its objectives, the decline of JPY against USD has not.

It is only close to reaching its 61.8% of its expansion at 144.841 from its double bottom formation. It has also crossed its 127% projection at 143.176

If this trend continue, I will see resistances between145.4207 to 149.7654.

Is this normal?

To be more certain, it is good to conduct a comparison between JPY and Nikkei.


Fig 3. Nikkei - JPY comparison

Based on the chart in Fig 3, I noted relatively normal behavior of JPY - Nikkei relationship, until early 2022. while Nikkei seemingly still in congestion band, JPY strengthened against USD, which could be indication that fund being pumped into the market. 

However, when Nikkei began to surge by 2023, JPY started to decline against USD. This as I see is possibility of funds leaving the market as demand of JPY is on the reduction.

I suspect the Japan market is in process of distribution. 

However, I must make it clear here, this is only my speculation based on what I see from the chart. 


Labels: , ,

5/20/2023

Nikkei run away surge

I have been writing this blog for years and in its early days, I have relatively high number of readers. Since I stop ped my entries some time ago, naturally the readership dropped to zero. 

As I restart my blog recently (like last year), there is an average 8 readers checking on articles. I am all right with this as my intention is simply to key in my thoughts and track my practice technical charting. 

Other than the 3 main indices of my interest and some key forex pairings, I occasionally check on counters falling into the limelight. My entries are some time here and there.

So it is to my surprise today that there is a whopping 150 viewers checking on my blog yesterday. I have no idea who they are, probably only knowing that it is from USA. I have no idea on which article that they are looking into. 

The only thing I suspect that people are checking on is Anheuser-Busch which was downgraded and on the way down.

Anyway, I believe this is a once in a blue moon incident on my blog. After all, the time of blogging is on a sunset streak.

As for today, I will limit my update to only Nikkei 225 and not on all 3 indices, the other 2  counters have still not much indication of breakout.


Fig 1Nikkei weekly chartIt has now reached 

It is interesting to note of a breakout on Nikkei 225. It touched a high of 30,980, 173 above the previous high of 30,807.

At the same time, it also crossed the 100% projection of a shorter-term projection at 30,345. The next level of resistance is the 127% projection mark of 31,645. 

To be honest, I do not find the break out from the previous high decisive, because Nikkei closed the week with 30,835, a mere 25 points above the resistance turned support mark, coincidentally below the Bollinger envelop of 30,851. 

I suspect the coming week will have Nikkei going to test the 127% projection level. At the same time, crossing 100% projection is with tendency of entering potential congestion stage before moving further. 

Another thing with the recent move of Nikkei. I am seeing multiples of 3-wave patterns giving me a feeling of counter wave moves. Can this be the c wave of the B wave? 

There are also another 2 points to note.

First, Nikkei also broke out of a double bottom and we can estimate a potential objective of between 32,157 (61.8% extension) to 33,985 (100% extension). However, it will also mean that we might be seeing a correction soon. Probably the resistance at 127% projection will ask Nikkei to retest the neckline of 29,231.

Now, this part is on a larger move, The counter began to congest after a surge ended in 2021. This congestion formed a potential projection target of between 33,360 to 39,216. 

If this is true, then Japan economy will be having a very good future.


Labels: ,

1/29/2023

Nikkei, Hang Seng and Dow Jones update -- 29th Jan 2023

It has been a while since my last up-date. It is not that I am getting lazy. 

I was quite busy with my son's course selection process after the release of his 'O' level result. My son's decision on his direction has been somewhat changing regularly and it needs quite an effort to finalize his choice of course. 

Most importantly, it is important to align his interest with his core strength. If your choice is based on your interest while not your core strength, or vise versa, your success rate of achieving your goal is 1/2. If neither, it is going to be a nightmare.

During my time, many people have no idea what they wanted, and they chose because their friends were there, or it was their only option because of their bad result. Most ended with jobs they dislike but were forced to continue for the money. whenever I drive on the streets I watch and observe the pedestrians crossing the roads. I feel that the life got sucked out of them and they are just going through the motion...for the money.

I do not want that to happen to my children, I will have to at least do my part to make sure they make the right choice. 

For every choice my son has made, I challenged him while he justified his stand. It was only when he did not sway fom his choice that I am certain that was what he wanted. It was not an easy process and there were quite a lot of frustration. In the end, he chose to head for Polytechnic, and he picked Civil Engineering. 

After that, I let him talk to my cousin who is a Civil Engineer by training and with experience in the field. It helped to strengthen his belief in making the right choice.

Meanwhile,I was still checking on the charts. The only issue is that I did not know what to update. Most of the counters were still in progress. Came last 2 weeks was Chinese New Year and I travelled back to Kuala Lumpur to visit my parents. This was when I stopped looking at the charts.

After at least 2 weeks of pause, I told myself today, " I must create some entries, or I will be stopping again."

So here goes.

Fig 1 Nikkei 225 weekly chart

Nikkei might be the one with the most surprises to me. In my last update in A plunge in Nikkei 225 this week, I estimated Nikkei would continue go down with pull back onto the moving average it crossed. 

It did a pull back as I expected. It began 2 weeks ago with a gapped down only to closed above the 144-week moving average by the end of the week. This also created an engulf pattern indicating reversal.  It further gapped up and closed above the moving averages by the end of this week. This gives confirmation to the pattern.

We shall see more uptrend in the coming week. Where are the resistance then?

Drawing trendlines using the peaks, I am seeing 28,529, which coincidentally the envelop of the Bollinger band. In addition, with the most recent 2 peaks, the more immediate resistance will be 27,994.

Additional point to note, the down trend is gradual as compared to the uptrend. I am still with impression of an eventual uptrend. The only issue is that I am still with impression that this down trend is yet to end. 

Probably its decision at the trendline resistance will give me more clue.  


Fig 2. Hang Seng weekly chart

In my last update in Slacking on the new year, I expected more uptrend from Hang Seng, it did with a run-away gap. 

It is now getting close to the 50% retracement, coincidentally close to the 144-week moving average at 23,007.

In addition, there are also other indication of possible trend reversal, including its break-out from the down trend trendline. It is also further supported with a golden cross between 8 and 55-week moving averages.

My original expectation was that Hang Seng may be in a correction phase. It seems that at this point, it may be on an uptrend at this point of time.
Fig3. Dow Jones weekly chart

It is trickier with Dow Jones. While crossing back above the moving averages, it continued to congest and even retested the 21-week moving average. There is still uncertainty as to where it will go.

For the time being, there is still a chance that Dow Jones may go lower by still strongly supported by the moving averages. In the long run, there are at least 2 indications that Dow will climb further. Its gradient of ascension is steep while the present pattern is more gradual.

For the time being, the more immediate resistance I see is the Bollinger envelop of 36,757.


Labels: , , , , ,

12/24/2022

A plunge in Nikkei 225 this week


I have decided to include this entry this week. In my last up-date on Nikkei 225 in After a week's break...... I was still positive on this counter while it was barely supported by the moving averages. It however, surprised the world with a plunged of over 900 points on Tuesday, 20thDecember 2022.

To be frank, I was happily trading this counter in the morning and moved away by 9:00AM. That was part of my strategy. It really took me by surprise when I checked on the market status by 3:00PM. but I do not regret not capturing this plunge, becaussse it is not part of my strategy.

It is due to a surprise move by Bank of Japan to consider relaxing the the tight limit set on their bond yield, leading to possibility of increase in interest rate in future. The move caught the market off guard and thus resulting in the Tuesday's plunge.


Fig 1. Nikkei 225 weekly chart

By the end of the week, Nikkei actually broke as stayed below the 144-week moving average. I estimate that the counter may try to reverse up in the coming week, but may be kept below the belt by the end of the coming week. If this is so, we will see continuation down trend.

Another observation is that Nikkei seems to be in a triangle formation. It has not been broken yet, therefore I will not use this as a gauge for measurement. 

There are 2 formations that enable me to use projection to estimate its support levels. The  first makes use of the top of the major trend and counter trend. However, the down trend here with a gradual slope and to it is not a very good indication for trend reversal confirmation. Giving me a sense that the whole thing might be a counter trend itself.

The support level using projection is between 23,108 to 25,443. 

Base on the more recent fluctuation on the other hand, I can see the more immediate support levels. It surpassed 26,276 and the next level is between 23,921 to 24,901.

If it reverses however,  it will be possible for Nikkei to surpass the previous major high.

What about its currency JPY? After all, interest rate affects currencies much more than others.


Fig 2. JPY weekly chart

Contrary to Nikkei, JPY actually strengthen against USD, meaning that the demand for JPY increased. I have spoken to my brother briefly, he is an accountant. He said it is logical, the demand for JPY and the drop in Nikkei is redirection of JPY for government bond.

What happened here is the drop of JPY (on the chart) is supported by its 55-week moving average, and the moving averages support remain intact.  It is possible a reversal might happen next week, IF  the bar next week tests but ends above the moving average.

For the time being, I will maintain the indication given by the counter. Using projection (again), I estimate the support be between 129.67 to 132.65.

Labels: , , ,

12/11/2022

After a week's break.....

 My entry last week mentioned that I did not have anything to up-date, mainly because most of the charts I was in progress of my prediction in my past entries.

I have made an attempt to write about FTX and crypto currencies. However, I put it on hold after I have begun, basically I have little interest in this group of "commodities", they are not real to me, and base on my read on Bitcoin (the representation of crypto to me), it is heading towards negative. I am not sure how the whole market will react when this happen. 

since then, I just focused on my daily trade, which is based on 3-minute chart working with hourly chart. 

Plus, I have to introduce some outings for my son as he has not much plan on what he wanted to do. We made a trip to Johore Bahru on Tuesday for father-son bonding.

By the end of the week, some interesting development happened, at least the way I see it.

Fig 1. Dow Jones weekly Chart

Dow Jones turned at its 38.2% retracement line with a strong burst up-ward.  

It seems to have turned again after breaking through the moving averages, with a seemingly hang man and along bar with color change. 

However, based on the behavior of its previous trend, I believe that it is a correction, with support of its 21-week moving average and its journey might end with support from 55-week moving average. It will then proceed to continue its main trend up-ward. 

As the move is yet to complete, 

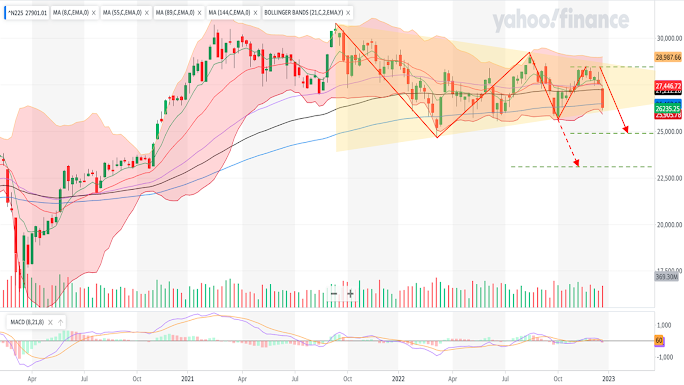
Fig 2. Nikkei225 weekly chart

Nikkei has been trying a few times to break its 144-week moving average and failed. It continued to have higher lows on every attempt.  After its last reversal on 2nd October 2022, its ascension was decent and only to congest after it broke through all the moving averages that I have placed.

Its latest descent after breaking through the congestion band, it is supported by multiple moving averages and to me it is poise t move up-ward. 

Using projection measurement, I will see resistance between 29,195 to 30,296 with Nikkei.
Fig 3. Hang Seng weekly chart

Hang Seng has is shooting up after reaching its 100% projection objective. It has a mild retreat after resistance from 21-week moving average but continued its trend up-ward. It has presently crossed its 61.8% retracement line with no sign of reversal.

Using projection, it is seen with close to reaching its 100% objective of 20,650, coincidentally its 55-week moving average as well as where the neckline is located.


Labels: , , , ,

11/13/2022

Dow Jones, Nikkei and Hang Seng Up-date 13th Nov 2022

I was quite distracted recently on events surrounding me. First was my on's GCE 'O' Level examination which only completed this week, followed by my curiosity into the tech companies namely those we used to known as dot com companies, and lately Malaysia General Election GE15 or PRU15 in Malaysia. My foccus this week is in fact the election progress. 

Even though I have only lied in Malaysia for 12 years while the rest of my life remained oversea. I still hold some attachment to the country I was born and on considered me as Pendatang and second-class citizen. Probably there is this part in me to hope Malaysia will one day change for the better. 

Seeing recent deterioration further disappoint my expectation. Most political parties have close to nothing to show and they adopt the tactic of 'he is worse than me' in hope to get elected. People are pitched to go against one another in the most partisan and racist manner. 

Words like traitor, corrupt, incompetence, religious extremist are used to downgrade their opponents for their own leverage. I cna't imagine what would happen when these people hold office for the next 5 years. my hope is for none of these parties to be able to carry a majority, forcing them to work for the people.

I did have up-dates on specific counters such as dow Jones when it seemingly turned in  Is Dow Jones reversing again? (23rd Oct 2022), and Nikkei in Let's do a Nikkei 225 up-date (29th Oct 2022), The last up-date on Hang Seng was in Dow Jones, Nikkei and Hang Seng Up-date 24th Sept 2022. I believe I need to check on this guy, for the last 2 weeks, it has been rising.

But before I move on, I would just like to share this picture.


Fig 1. Dow Jones, Nikkei and Hang Seng on a single screen

When I put the 3 charts side by side, I can't help but to notice that it looks like the move of a single counter. Can it be some form of prophecy as o what to expect in the future?

Meanwhile let's move on.


Fig 2. Dow Jones Weekly Chart

In my last entry on Dow Jones, I predicted its 55-week moving average would be the next test point with resistance between 32,159 and 32,430. Dow Jones crossed this point the week before last and closed above the moving average by the end of the week. It moved on higher last week. It is also interesting to note at this pont that the MACD has crossed the neutral line, providing more confidence of further move in the same direction.

What follows is less complex. The present trend is up, using projection measurement, I can derive its resistance between 34,452 and 36,138.

However, a more crucial resistance at this moment is the previous high at 34,281, coincidentally the bottom of the upper Bollinger envelop descent. It will not be much of an issue if enough momentum is gained. Otherwise, there is a possibility of short congestion.

One might ask: The Fed has just increased interest rate by 0.75 to further reduce cash flow, why the market continue to rise at this point? The answer is 'anticipation'.

The market is always about the future, increase interest means price is still going to rise, and pushes the index upward. It is the announcement of halt to interest increment that market begin to fall.


Fig 3. Nikkei Weekly Chart
I have in the past more positive on Nikkei than the other 2 counters. Lately however, I feel that Nikkei has yet to complete is down trend.

In my last entry, I have more downside readings than up, with multiple support level between 21,874 to 25,444, while resistance at Bollinger envelop of 29,062.

While Nikkei rised last week due to influence of US interest rate and Dow Jones, its behavior is different, I do not see momentum prior to this ascension and closing 2 weeks ago remained below the 55-week moving average. the general pattern still remains as side trend.

Its present resistance from the Bollinger envelop has dropped slightly to 29,061. in addition, I will add another resistance which is the previous high at 29,222.


Fig 4. HSI Weekly Chart
HSI is te only chart that I did not up-date for a long time. It has maintained its down trend diligently until 2 weeks ago a bar turned green closing above the close of previous week. It maintained in that direction with similar force last week. Does it mean that HSI has also reversed?

I am still skeptical if it is a reversal. While China has shown sign of relaxing the pandemic control. There was no action from them on salvaging the deterioration of China's economy. 

The Hong Kong government is more anxious as they are sensing the danger of Hong Kong collapse. However, no oe dare to overwrite their boss from the north initiating full reopening of the city, let alone setting up stimulus policies to reinitiate the economy.

With 50 -60% of Hong Kong's stock market portfolio with companies of China origin. It is an up-hill battle for HSI to reverse.

On the technical side, Hang Seng has reached 2 different milestones, meeting the objective of both a major and minor zig zags at both 18,838 and 14,753. I have anticipated a few times in the past of a correction, and it did not happen. I believe it is doing so now.

I am still seeing strong pressure from the moving averages downward even with this spike, further indicating that the down trend is not yet over. 

I believe that it will retrace back to the 55-week moving average or higher before it perform one more leg down.

There is a much larger set up forming a double top with measurement reaching as low as 8,794 using expansion. For the time being it will be better to just focus on what we might expect in the near future. The level that low might be more long term.


Labels: , , , ,

10/29/2022

Let's do a Nikkei 225 up-date

It is an uneventful eek this week....Well not very uneventful. something did happen on Hang Seng on Monday after the closing of the 20th People General Assembly on Sunday.  ALL CHINA RELATED MARKET FELL HARD! However, it is still in he direction of my prediction in The HSI monthly chartAfter thought of HKD and China indices and Contradiction, contradiction...... So not much to talk about for the time being.

I have also done an up-date on Dow Jones Industrial Index (DJIA) last week with Is Dow Jones reversing again?. DJIA reached the 55-week moving average this week, moreover, it crossed and stayed above the level, and the bar is longer than the previous week, seems like the momentum is getting stronger. I guess 

Guess I will only have one counter to up-date then, Nikkei 225.

 Fig 1. Nikkei weekly Chart

To be honest, I am a little reluctant to discuss about Nikkei 225 here. It is still in a potentially counterwave. While it has moved up this week, it failed in testing Nikkei heading lower is high. 

Where will it go? 

I am not sure if I have given an update on this, using projection measurement, its next level of support lies between 23,108 to 25,444.

Duing its last few lows, it was supported by 144-week moving average and managed to stay above the retracement support at 25,292. Considering the present setup, it is possible the next round of downslide will break this leveland head for the retracement between 21,874 and 23,567.

Matching the result of both measurements, I think the 23,108 to 23567 is highly likely. 

What about the other way? I would consider the Bollinger envelop at 29,062 to be the resistance.


Labels:

9/24/2022

Dow Jones, Nikkei and Hang Seng Up-date 24th Sept 2022

 It has been a turbulent week for the financial market.

First Putin falsifying the reality lying to his people for reinforcement and threaten the world with nuclear warfare, on the other side, the Federal Reserve rate hike of another 0.75%. This causes uncertainty on the financial market, making it a challenge to predict the market. 

I have not done any update on Dow Jones, Nikkei and Hang Seng for quite a while. My last up-date was on 5th Sept 2022 noting the effect of Powell's effect on the market titled the continuing Powell's effect on the indices. While there was also mentioned on the sudden drop of the indices in the sudden plunge of indices last night and present status of currencies, the entry focused more on the currency fluctuation.

I was a little reluctant for the update on the 3 counters the last 2 weeks. For one, it was too short a lapsse time and the counters must be allowed to work their courses. 

How have the 3 counters developed the 2 weeks since?


Fig 1. Dow Jones Weekly Chart

Dow Jones continued to move in alignment with the prediction of the continuing Powell's effect on the indices. In fact, there is momentum in its move, and firmly broke through even the 144-week moving averages well as the previous low.

It is only stopped by the Bollinger envelop this week but stayed outside the band. It might have a little difficulty next week to decide if it is going to stay outside or come back in. 

Base on the latest development, the full wave measurement (in red), support lies between 26,982 to 29770. while the minor wave measurement support level can be found at 28,442. These levels base on projection measurement.

In addition, I can use the same set up to come up with the expansion support, while lies between 22,354 to 25142.

Let's move on to Nikkei 225.

Fig 2. Nikkei 225 Weekly Chart

Even though Nikkei 225 seemingly affected by the drastic drop in Dow Jones, it nevertheless reluctant to follow full heartedly. It is stopped by the 89-week moving average. The situation on Nikkei is not as bad as Dow Jones. 

Even dropping below the 89-week moving, there is still one more layer of support at 144-week moving average. 

However, based on the counterwave upward, it is possible to see a 3 waves movement with a 3-wave B wave that formed a rectangle. I will still have to assume a possibility of a downward C wave. 

Using projection measurement, support level is seen between 23,108 to 25,443. In addition, I can use the same set up for an expansion support at 18,567. 

The expansion measurement is quite scary, it is close to a 50% drop from its top at 30,795. On a personal level, I believe that for this to come true, Nikkei has to break the low of 24,681. no matter what it is still one of the possibilities.

what of Hang Seng?


Fig 3. Hang Seng Weekly Chart

I did an entry on Hang Seng monthly chart earlier in The HSI monthly chart. However, I pondered much about its more short-term objectives. First of all, there was a strong rebound, this followed by a more sluggish downward movement. In addition, Hang Seng was reluctant in crossing the previous low.

This let me believe that there is a possibility that Hang Seng might correct before its continuation down trend as I described in the continuing Powell's effect on the indices

The move this week changes everything. It crossed the previous low, making it more certain of its continuation downward, it is less likely to correct upward.

There are actually 3 set ups that I can use for Hang Seng. There are 2 projections, one of which Hang Seng has reached, lying between 18,838 to 23,553, the next level, 127% projection will support at 15,480.

Using the minor wave measurement, support level at between 15,708 to 18,311. Hang Seng has penetrated the upper end of this zone.

At the present moment, I can also utilize expansion measurement, support level is between 11,420 to 14,023.


Labels: , ,

9/14/2022

The sudden plunge of indices last night and present status of currencies

 I was lazing at my station last night with the Dow Jones Chart turned on. I remember it was around 8:00PM plus (Singapore time). I was watching some video on Youtube.com when all the sudden I noticed a sudden plunge on Dow Jones 3-minute chart, it was exactly 8:30PM. 

I was taken aback with the sharp descend. While I faithfully follow the principle of technical analysis which discount any fundamentals, I can't help but to think, " what happened?"  

I quickly check on other indices and I found similar situation even on Nikkei and Hang Seng. I even checked on the German index DAX and the same thing happened, there must be an event that shook the market.


Fig 1. Nikkei225, Hang Seng and Dow Jones 3-minute chart

Turn out there is a Fed report that while the rate was raised, inflation in August was above expectation at 8.3%, rose by 0.1% compared to previous month.

Anyway, as I have said, I was lazing. I was too tired to do anything about it, Furthermore, this may lead to congestion, and I was not really keen on Dow Jones as it means mid night trading for me.

As for today, my main intention is on currencies as there has been much hype about weakening currencies. Already many experts have been telling people that it is not the weakening of the currencies of their countries, it is the strengthening of USD. This was also what I mentioned in What is USD doing?

I will focus on 3 currencies today to determine where they go: JPY, EUR and GBP. Even though technical analysis supposed to enable quick analysis, it does take time to analyze each chart.

Let's start with JPY since there is so much warning from youtube.com videos that JPY is very weak against USD even though it is known as a safe haven currency. 


Fig 2. JPY weekly chart

Based on my interpretation, there are 2 zig zag patterns and, in a way, form a double bottom, so there are 3 measurements. In the long run (blue zig zag), it has already crossed the 61.8% projection at 136 and heading to 146. 

we can ignore the other zig zag as well as the double bottom. The objectives were much lower and surpass.  

Breaking146, the next level of resistance is 159. Will it go further than that? Possible, but let's focus on the more immediate ones first.

Let's move on to EUR.


Fig 3. EUR weekly chart

Interesting enough, there are also 2 zig zags and one double bottom (more like a triangle). 

With the longer-term zig zag (in blue), it has already past the 61.8% projection at 0.9505, the next level of resistance is the 100% projection at 1.046 and 127% projection at 1.114.

 As for the double bottom (or triangle), the resistance is even further at 1.082.

As for the smaller zig zag (in green), the next level off resistance is 161.8% projection at 1.041.

So 1.04+ is really one level to watch out for.

Finally, let's move on to the last currency of this entry, GBP.


Fig 3. GBP weekly chart

Unlike the other 2, GBP lacks the formation of double bottom (or triangle). There are only 2 zig zags that I can measure with projection.

Using the longer-term zig zag (in blue), the 100% projection resistance at 0.948 while 127% at 1.0165.

The more immediate set up on the other hand, resistance at 100% projection is 0.877 while 127% at 0.9246.

While the oil price is kind of stabilized in US, it is because of a stronger USD. For other countries however, we will continue to see higher prices on oil, unfortunately.


Labels: , , , , ,

9/05/2022

The continuing Powell's effect on the indices

 well, I am still in the midst of my trip in Kuala Lumpur and so, still no trading because of too much erants.

However, I feel that I need to have an up-date on Dow, Nikkei and Hang Seng to maintain my attachment on the market. I will still limit my review on the 3 main indices I am focusing on.


Fig 1. Dow Jones Weekly Chart


Dow as it seemed did not pause last week after crossing and instead continued its journey downward. Apparently, Powell's speech was kind of difficult to digest.

The momentum is still strong as the bars barely crossing each other and it is now resisted by the 8 and89-week moving averages.

I did a projection measurement base on the latest set up and the next level of supports are 28,544 and 26,982. But one important point to note is the previous low of 29,653, a minor correction might happen at that point.


Fig 2. Nikkei Weekly Chart

The turbulence on Dow Jones has certainnly affected Nikkei, causing it to gap down and 'plunged" only to be supported by both 21 and 55-week moving averages. 

So far, Nikkei is the only index of the 3 who is still floating above the moving averages. and based on figure 2, there are a few possibilities of projection reading, blue line projection leads to resistance of 29,177, which was reached on 14th August 2022. It has since reversed due to Powell.

So the next measurement on the same set up leads to support level of 27,007 to 26,404. Now, based on the present wave structure, is this a viable level?

With the present development, it is possible that Nikkei might drop further. The Zig Zag movement give me the feeling that it is in a B wave so C may be much longer and crosses the bottom of A.

Thus the red line projection reading.

 The support for this set up lies between 25,443 to 23,108.

However, you can call me out for being bias. Of the 3 indices, this is still the only one floating above the moving average, with exception of the 8-week moving average. There is still a chance that the projection estimation may not come through.


Fig 3. Hang Seng weekly Chart

We finally come to Hang Seng index. While it has been consistent so far staying below the moving averages, the set up since 13th March 2022 (a reversal indication) it gives me a feeling that Hang Seng is in a correction phase. 

There are more indications recently with continuous congestion since31st July 2022. While Powell's speech shook the world, it did not cause Hang Seng to go lower, but instead staying within the congestion band.

It is therefore possible for Hang Seng to move upward at least towards its 55-week moving average with formation of a rectangle.

If based a projection setup, we see a resistance between 22,548 to 23,466, where present 89-week moving average lies. But 22,523 is a level to watch out for as this is the boundary of the rectangle formation.

If I conduct a projection measurement using the rectangle formation, the support levels are 20,381 to 19,104, which explain the present congestion.


Labels: , ,

8/21/2022

Follow up on Dow Jones behavior and comparison with Nikkei and Hang Seng

I have mentioned Dow Jones Industrial Index ( DJIA ) in my entry Are we in a bear market already? yesterday. while doing so, I have noticed the latest up-date of Dow, it reminded me that I  have expressed uncertainty on Dow in Dow Jones, Hang Seng & Nikkei Up-dates - 13/8/2022 and I thought I need to follow up on Dow Jones direction before I move on.


Fig 1. Dow Jones Weekly Chart & Comparison With Nikkei 225 And Hang Seng

For the chart in Fig 1, I have included Nikkei 225 and Hang Seng index. I have found that it might be a good idea to put 3 charts into 1 as we can see how each counter perform compare with others.

First, let's talk about Dow Jones. Dow Jones just broke the 55-week moving average upward last week. It is possible that the penetration is weak and there is a possibility to retrace 100% with continuation downward.

It did not happen, instead the formation of a shorting star. However, I believe the shorting star does not signify a reversal but a correction. I am likely to see Dow Jones heading down in coming week and may congest the next 2 or 3 weeks before continue up-ward. 

Reasons for my deduction are as follows:
  1. It is supported by 8, 21 and 55-week moving averages at this point of time;
  2. 8-week moving average just crossed 21-week moving average with a golden cross, meaning a possible short term uptrend;
  3. The size of shooting star is small and less significant as a sign of reversal;
  4. The climb of Dow is steep, there are momentum heading up;
  5. It crossed the previous high (  minor wave );
The next significant level to me the peak at 36,952 and 35,410, which the Bollinger envelop presently lies.

With putting the 3 indices together, we can see when they start to disconnect with DJIA and each other.

Beginning of 2018 for instance is where we see the beginning of  Hang Seng's decline. While Nikkei and DJIA entered a correction phase, Hang Seng tumbled. In fact, Hang Seng seemed to used a 3-year spread to form a double top with failure swing and began to plunge by 2020. It was saved by the Covid-19 lock down, stopping at the neckline, other wise I believe the depreciation would have been worse.

However it is not helping Hang Seng, because by beginning of 2021, it began to disconnect with Dow Jones and on its descend again. It has crossed the previous low which now become the new neckline of a much larger double top. At this point my article The HSI monthly chart applies.

While Nikkei traces the progress of Dow Jones between 2017 to 2020,it failed to reach new height and plunge by 2020on double top completion, again it was saved by the Covid-19 lockdown.

It is interesting to note that like Hang Seng, Nikkei also disconnect from Dow in 2021, but unlike Hang Seng, it corrected and by beginning of 2022 it reversed and continued its upward climb. It is also interesting to note that it is also in the beginning of 2021 that Nikkei overtake Hang Seng.

Base on the present set up, we can use projection to measure the next level of resistance, which is between 33,603 to 39,118.


Labels: , ,

8/14/2022

Dow Jones, Hang Seng & Nikkei Up-dates - 13/8/2022

 I am supposed to have more regular up-dates on these 3 indices since my trading revolves around them. I was lately distracted by things happening with other components of the market that I did not conduct any up-date, till now of course.

My last up-date on this was Dow Jones, Nikkei & Hang Seng Up-date 3/7/2022, which is more than a month ago. A lot has happened, most notably the rise of interest rate, an external influence to the behaviors of the indices.

Interest rate rise by theory should restrict money circulation with heavier cost on borrowing. Lower circulation should then lead to less money in stock market and therefore limiting the upward movement of financial market. With lesser circulation also also means less spending and helps to slow down inflation.

The truth however is the opposite for stock market, because it is driven by anticipation. I remember that Alan Greenspan kept increasing interest rate during early 2000 while the market was spiking up-ward. However, the market spiked further because the player took this that the market is going higher. So what stopped the market?

When Alan Greenspan said no more interest rate hike and the existing interest rate level was sufficient. It caused the market to tumble.

So what has happened to the 3 indices while I was distracted?


Fig 1. Hang Seng Weekly Chart

Let's start with Hang Seng, I have ranged the chart to include a huge double top formation. As I have  written in an earlier article The HSI monthly chart on 24th July 2022, the objective is at around 8,440 with another support at 13,244.

For the time being, Hang Seng created a double doji supported by its Bollinger envelop as well as the 61.8% retracement line., does it mean that it is reversing upward?

I have experienced in the past that a counter can retrace to close to 100% before continuation, but there are a few observation that make me ponder if it is actually reversing upward. 

First, there is a double-doji which failed to climb higher., the bodies of the dojis are quite small. They are resisted by the 61.8% projection support turned resistance. It has yet to reach the 100% mark.

Second, the moving average formations are too determined on downward continuation, at the same time, the gradient of descend is steep. 

Finally, the previous high of Hang Seng did not supercede its predecessor. 

The possibility of further descend is high.  I would see support at between 18,063 and 19,028.

Fig. 2 Dow Jones weekly Chart

In my last entry on this counter, I remained bearish with Dow Jones, that was right after  the week with an interest rate hike . The counter maintained congested for the next 2 weeks before it broke through and shot upward.

With the latest interest rate hike on 26th July 2022, it broke through the 55-week moving average this week, and the up-trend is steep, indicating momentum in its movement. It is only stopped by its 161.8% projection resistance. while supported by its 127% projection line.

I have included a retracement measurement on this chart and I would expect resistance at 78.6% retracement line @ 35,432, coinciding with its present Bollinger envelop.

If we take a further step backward to as early as 22nd March 2022. I can see a projection with resistance @ between 41,266 to 48,422. The question is: Can this even be possible for the near future?

May be we should not go so far for the time being.  The most immediate threat of its ascension is the 55-week moving average that it has just crossed. It is possible that it makes a 100% retracement. So the coming week is very important to determine if it is going to be a continuation or reversal.


Fig 3. Nikkei Weekly Chart

Nikkei was the counter that gave me the most dilemma, In my article Dow Jones, Nikkei & Hang Seng Up-date 26/6/2022, I was most positive about Nikkei, but the "failure" the subsequent week made me questioned my competency. 

It has since reversed, broke through 55-week moving average by 17th July 2022 and presently on its way up. Its move this week is only stopped by its Bollinger envelop. However, the band is reversing up  and it is possible for Nikkei to move higher the coming week.

So where am I seeing resistance? 

Using projection measurement, its resistance is between 29,664 to 30,776. Now, this is the most immediate resistance level. Like Dow Jones, it is on continuation after a congestion and we may even see it go higher, but let's allow it to reach  30,776 first. 

Where is the level that the set up might fail?

Using retracement measurement, it has just crossed the 61.8% retracement line and the 78.6% retracement at 29,460. I am likely to see some resistance at that level.


Labels: , ,

7/03/2022

Dow Jones, Nikkei & Hang seng Up-date 3/7/2022

When we set a goal, we will usually find life throwing barriers after barriers at us. 

I determined to have at least 1 entry per week, I went back to Malaysia for a week, breaking my patterns for 2 weeks. I penalized myself for the break to my blog last week, my mother-in-law's domestic help on-leave for 3 weeks starting this week and my mum-in-law staying at my place during the weekend, loading my workload at home, thereby risking another off-course on my blog.

Nevertheless, I managed to find some time in the morning for this, lucky me!

So what am I going to type iin this week?

While I did an entry on Dow Jones, Nikkei and Hang Seng last week, I did not really work much on the measurements. I have decided to work out how much they are going to move.

Fig 1. Dow Jones weekly chart

I am starting with Dow Jones here. I did not have a good feel on this counter last week. This week, it went up a the beginning for the week, only to retreat after resisted by the 8-week moving average. By the end of the week, it closed below the 144-week moving average.

Above that, the bodies of the bars overlapping while trying to climb. It is certainly tough for Dow to gain momentum.

Conducting a projection measurement, Dow Jones just bounced from its 100% projection support. Based on what I was taught, this would be a point when I should load a long order as it indicates a reversal. 

However, the last few times I did this, I found the reversal was weak and almost immediately went against my expectation. 

 I must therefore maintain a short position as a result. So where are the support level for Dow? 

More immediate, I should see support at 29,564 and if fail, between 27,160 to 28,514, The target for the present set up would be 26,999 to 28,049.

Fig 2. Nikkei weekly chart

Let's move on to Nikkei, I was more positive on this counter as the descend was more gradual. I anticipated the possibility of reversal. However, it failed after its test on up-side and stopped below both its 61.8% projection resistance, 89 and 21-week moving averages. 

In addition, the bars are overlapping, the momentum is weak.

The chance of further downslide is high.

What are the supports for Nikkei then?

The most immediate support is between 24,994 to 25,278. However, I am sensing something move serious, a double top formed between dec2020 to Feb 2022. The minimum objective for this formation is 23,085.  

Fig 3. Hang Seng weekly chart

WE finally come to Hang Seng, while affected by other indices, it managed to climb higher and closed positive above 21-week moving average, even though we are seeing a shooting star, the set-up is giving me more confidence that it is still on the up-climb.

The only concern I have is the reduction in its momentum. The gradient of its latest climb is less than that of its descent. 

Anyway, assuming it continue in its climb, I should see resistance at 23,418 to 23,759, that is if it is able to break through its present resistance of 22,039.  

If it unfortunately fails and reversed, I should see immediate support between 18,548 to 20,390. 

Fig 4. Hang Seng monthly chart

I am rather curious about Hang Seng's behavior. Is Hang Seng truly going up indicating an improvement on Hong Kong and China's situation?

I zoomed out It is really not looking good. I am not too sure how big a scale can technical analysis can go, the deterioration since January 2018 may have formed a double top. Question is: Can a top formation take 5 years to form?

Based on the 100% expansion measurement, Hang Seng is going to hit at low of 8,500, close to a quarter of its peak at 33,279.

Is this possible? Well, if we adopt Marvel Dr Strange multi-verse ideology, this is one of the possibilities. 

For the moment, though, the more immediate influence is the projection objective based on January 2018, March 2020 and February 2021, Hang Seng actually bounced back from its 100% projection by March 2022, there is a possibility that it might be in the process of bottom formation, time will tell.

Labels: , ,