Google
 
Web thoughts-denzuko1.blogspot.com

My Charting Blog

It is interesting that I start off this Blog when the Singapore Stock Market is heading south. However, this makes it more interesting for me to write on as the market turned volatile. My interest is Technical Analysis, TA for short. I love to look at charts and predicting where they are heading. This blog is or me to record my thoughts on the market. The articles on this blog are based solely on my personal opinion on the charts that I read and readers should not take it as absolute.

10/12/2025

Interesting Nikkei behavior

Japan has a new prime minister last weekend. 

The Shigeru Ishiba resigned as the prime minister following major electoral defeats of the LDP-Komeito coalition. This followed with an LDP presidential election with Sanae Takaichi won. 

As a result, she became the first female prime minister of Japan. On appearance, Sanae Takaichi is more conservative with Japan's interest come first. Her mindset seems to be similar to that of Trump, except that she is more protectionist in area of immigration.

well, I did not take much note of it and went on minding my own business, after all, it was weekend!

It was to my surprise on Monday morning that Nikkei 225 actually opened with a 2,000 points gapped up! 

However, it only went mildly upward before deteriorating throughout the week, losing every single point gain from gap up.

It is common for a counter to try recover a gap before continuation. However, attention is really needed if the gap is fully covered, it indicates weakness in the direction. Is Nikkei in possible reversal?


Fig 1. Nikkei weekly chart

My last up-date on Nikkei was Let's have an up-date.. in April 2025. I believed at that time that Nikkei should be on continuation downward. 

Nikkei did not, reversed and even breaking the previous high. 

At present, it managed to reach the 100% projection resistance of a major move. 

I believe it is going to correct in the coming weeks, but it may not be ready for reversal just yet.

Reason?

There is not yet evidence of divergence for Nikkei on the MACD. Even though there is a potential sign of MACD crossing at this point of time, it is still in the positive zone, except that its momentum is getting weaker.

Where lies the support then?

I will use its 55-week moving average as reference for its support, which is 39,814.

Should there be break through on the upside however, I believe its 127% projection of 53,044 will be its next resistance.


Labels: , ,

4/20/2025

Let's do an up-date..

 I have not done this for a long time, and today I feel a little itchy because of the long weekend, I just felt like checking up on the charts.

Furthermore, I am too engrossed into 3-minute charts to the extent that I have not checked on its higher time frame. It may be a good time to have a change.


Fig 1. Dow Jones weekly chart
My last up-date on the Dow was Now that the election is over, how it's going?, at the time I estimated that the Dow will climb a little further and I was contemplating a reversal.

It climbed mildly higher before a major plunge and rise back up again. It however failed to break through its previous high and began to retreat in fear of the effect of Trump's tariff on other countries.

It managed to get support at its 144-week moving average, with this week bouncing back towards its 55-week moving average. Coincidentally, this is also the 100% extension support, which is the minimum objective of its double top formation. It is also the 61.8% retracement support level.

I do not find this very good for the Dow though, because the bars are overlapping. This indicates a congestion instead of a reversal upward. 

In addition, I am seeing false break on 22/10/2024, indicating weakness on its up trend. 

I suspect it will continue to head upward with resistance, but it's down trend is yet complete.

However, I believe that the present down trend is a minor move, because there is still no confirmation from MACD. I think we are witnessing a top formation at this point of time. 

So where are the resistances and supports?

I really do not see any indication of uptrend. however, I can base on both the 55-weeks moving average and the Bollinger envelop as a guideline. We should see resistance at between 41,135 to 45,863. 

If it moves further downward, we should see support at its 261.8% projection of 36,280. This follows by its 78.6% retracement at 35,150.

Fig 2. Nikkei weekly chart

My last update on Nikkei was even earlier in Is Japan on continuation upward?, In that article, I was adamant that Nikkei was congesting but will climb higher with major resistances ahead.

It climbed higher with much difficulty, failed to reach the resistance level of my expectation, eventually succumbed to the threat of Trump's Tariff, plunging below its 144-week moving average, also breaking through its uptrend trend line. 

However, this is not the first time Nikkei breaks its trend line, there was a false break on week of 4/8/2024. The worrying part here is that the break on week of 6/4/2025 went further than 4/8/2024, not only creating a potential double top formation, but the latest break is also challenging its neckline.

The difference between Nikkei and Dow Jones, however, is its bar formation. While Dow Jones bars overlap, Nikkei did not. It is possible that Nikkei will correct better than Dow Jones. For the time being, the more probable resistance would be its 55-week moving average at 37,265.

It is relatively tough for me to estimate the direction Nikkei, mainly because it is at a crossroad at this point of time. Nevertheless, I believe Nikkei may have more room for down trend.

The main reason is due to MACD is in the negative zone at this point of time. Furthermore, it is presently at its 61.8% projection support level, giving me the impression of continuation after its correction. It's next level of support would be 28,826.


Fig 3. Hang Seng weekly chart

My update on Hang Seng was Dark cloud covers Hang Seng. I was with impression that Hang Seng was on the way down, with support at 55-week moving average. 

It went as I predicted, reversed at the support level and reached a higher high. However, this created a formation more common to a counter wave behavior. 

Furthermore, Hang Seng has just crossed 100% projection resisted by its 127% projection level. This followed by a major gap down back to its 55-week moving average.

While it was trying to recover itself, it was again resisted by its 21-week moving average.  

While I believe that this is would be a correction, I think it is trying to cover the gap and will be in continuation downward after this.

From here on there are a few support levels, including its Bollinger envelop of 18,181, its 61.8% projection support of 14,477.

What if it goes further higher? 

ITs next level of resistance will be its 8-week moving average of 22,227 and Bollinger envelop of 24,979. 

Labels: , , , , ,

10/19/2024

Is Japan on continuation upward?

I was going through all my entries contemplating what I shall explore this week. 

I first looked at Dow Jones and noted that it is on its way up with potential objective of between 45,000 to 47,000. I guess that it may not be the right time to conduct a study on this counter. It was only September that I have made an entry on this. I believe that with Dow will continue to climb until the completion of the US election, which reversal will appear, after all, the trading market is always about anticipation.

What shall I research on then?

It was about 2 months ago that I made an entry on Japan situation through The curious case of JPY-Nikkei divergence on 4th August 2024. I guess it is about time that I check on this counter, then.


Fig 1. JPY weekly chart

In my last entry, I estimated the possibility of correction before further downslide (JPY strengthen against USD). Unfortunately, JPY refused to wait and in continuation without correction. While it managed to reach new low, there was a lack of momentum and reversed upward after re-bounced from its 144-week moving average support.

The question here is: Is this a correction or trend reversal?

Based on the chart, there are a lot of indications of an uptrend (check out the arrows). The issue here is that the uptrend started by the end of 2023 has a reduced level of momentum. The reversal by June 2024 witnessed a steep decline before it reached its 144-weeek moving average support.

What's more, there is a divergence on MACD, providing more justification of down trend (JPY strengthening against USD). 

I still believe that JPY is on a correction phase with resistance at 153, its 61.8% retracement and projection. It may reverse and continue downward thereafter.

On continuation downward, it is crucial to note the support at 139.58. This is the previous low which turn the neckline. Should JPY cross this level, we should see support at 125.73 with its objective at117.226.


Fig 2. Nikkei weekly chart

In my last entry, I noted Nikkei to continue its down trend with minimum objective of 32,039, considering a double top formation, with additional support from its 144-week moving average at 32,217.

The momentum of its down trend was so strong that Nikkei plunged below my estimated levels, reaching a low of 30,632. This followed by a strong recovery with a hammer candlestick indicating a reversal upward. 

While there was divergence on MACD prior to its fall, I think its predicted move might have been fulfilled. It has been climbing up since then only to congest at its 61.8% projection. I believe that it will continue upward upon breaking through this congestive level. 

There will be a few resistances ahead though. the first resistance zone between 40,970 to 41,620. The next resistance level after crossing this will be between 42,843 to 43,301. This zone will be stronger as there is a total of 3 projection resistances in this zone.


Labels: , ,

8/04/2024

The curious case of JPY-Nikkei divergence

July this year is really a crazy one for me, lots been happening. My son's project, from his course as well as the competition, Noy to mention my daughter is finally started her journey through University. 

Finally, life is settling down by the end of the month and what happened on arrival of August? 

Nikkei was down 1,733 plus points in one day, while whole day fluctuation reached a range of 2,388, closing at 34,928.

While this was happening, JPY strengthened by 2.803, with fluctuated range of 3.361, closing at 146.5560.

I am not sure what happened as I was still trying to re-adjust back to my normal life. But my interest is only on the chart. So just look at the chart.

I did an entry on Nikkei "Is Nikkei firm on continuation downward?" on 1st of June 2024 and JPY in JPY is....ENGULFed!!! dated 4th of May 2024. I estimated a potential reversal then for both counters. They did not, at least not yet at the time. Both counters went on further continuation only to reversal after hitting the Bollinger envelop.

So what is happening now?


Fig 1. JPY weekly chart

JPY reached the 61.8% level of a major projection before it reversed, and the reversal was with momentum. Its descend even dropped below its 55-week moving average this week, closing below the level only supported by its Bollinger envelop.

I rarely use project such reversal as it went above the previous high. However, due to its gradual gradient  upward after a steep drop, I believe his is applicable. 

Using the projection measurement downward, it can be seen that JPY already dropped below its 161% level and 23.6% retracement line. 

The next level of support will be its 89 weeks moving average at 145.601, beraking this point, the nextr level of support will be 139.811, which also coincide with its 38.1% retracement (138.645) and its 144 weeks moving average.

Having said that, it was a steep drop this week and I believe a correction or congestion in the coming weeks before continuation.

If I consider the recent formation a double top, it is possible to measure an objective, which is 143.141. This also mean a potential retracement back to its neckline at 151.859 before continuation.

Fig 2. Nikkei 225 weekly chart

When I look at Nikkei 225 chart, I can't help but to note that similarity between Nikkei and JPY at this point of time, except that Nikkei is weakening while JPY is strengthening. 

The difference is that Nikkei crossed the 100% of its major and minor projections while failing to reach its 127% major projection resistance, it crossed the 127% minor projection before retreating.

Using projection measurement downward, similar to JPY read, it is noted JPY is presently supported by its 161% projection (34,973) which coincide with its Bollinger envelop (35,442), closing at 34,928 at the end of the week.

Similar to JPY, I expect a potential correction or congestion before continuation downward. Like JPY, I can also consider a double top formation with a minimum objective of 32,039 which with neckline of 36,688, the retracement may reach back to this neckline before continuation, this also coincide with its present 144-week moving average at 32,217.

This one thing I do not understand is why the continual divergence which JPY does not follows the behavior of Nikkei. In general, a rise in index would indicate a long for shares therefore an increase in demand for the currency, vice versa. With such a sharp fall on the index, I would consider an exit from the market leading to weakening of JPY, yet the demand of the currency increases. Unless someone is accumulating and expecting Nikkei to go higher.

Anyway, I believe this will be an issue of fundamental analysis.

Labels: , ,

6/01/2024

Is Nikkei firm on continuation downward?

In my last update on Nikkei "Is Nikkei beginning it's descend?" dated 20th April 2024,I estimated that Nikkei is likely to correct before continuation on its descent as its descent at the time was supported by its 21-week moving average. 

Since then, Nikkei indeed corrected until this week, when it tests its 8-week moving average only to retreat by the end of the week, creating a potential hammer candlestick.

Does it mean Nikkei is going to continue its journey downward from now?

Fig 1. Nikkei weekly chart

Let's start with the gradient of its uptrend, which is very steep, it indicates momentum upward prior to its descent. It follows by the hammer this week which Nikkei fails to break through, giving me impression that there is some weakness in its fall. It is possible that Nikkei is presently correcting and will head higher after that.

The next question is whether Nikkei has completed its correction or there are more down side?

While supported by both its 8 and 21-week moving average this week, I believe that it will retest these supports before heading down towards its 55-week moving average, which coincide with the 100% projection support presently at 35,077. 

What if I am wrong?

Then we will see its resistance at the Bollinger envelop at 40,772, which also coincide with its 127% projection resistance.

The thing is that Nikkei has already crossed the 100% projection resistance of a major move and there is limited upside. The chance of it heading downward is higher. 

Will it break 55-week moving average and make its descent more permanent?

That will depend on it momentum in its next phase.


Labels: , ,

4/20/2024

Is Nikkei beginning it's descend?

I touched on Dow Jones again last week noting its gain in momentum for descend, which leads me to look into other indices more related to me. 

So I will concentrate on Nikkei 225 this week.

The last time I checked on Nikkei225 was on the last day of year 2023, when I did a year end review of the 3 main indices and recorded in Year End Review of Dow Jones, Nikkei and Hang Seng dated 31st December 2023.

I used the monthly chart then for my analysis to enable a farther vision of the counter.  I was with an opinion that Nikkei should be rising up with resistance observed between 35,500 to 38,500. 

Since then, I have not touched on Nikkei over its higher time frame, since the time frame I used (3 minutes chart) for my trading is too far from the higher time frames to be affected.

It takes a long time for a 3-minute chart to reach the next resistance / support level on a monthly or even weekly chart. Even when reaching the said levels, it fluctuates in such wide dynamic range.

In short, daily chart is useful enough for movement prediction.


Fig 2. Nikkei weekly chart

Since my last read, Nikkei has broken through the resistance levels that I have highlighted, reaching a high of 41,124 before retreating. This also coincide with the 100% projection resistance of its major move. 

Its descend is with momentum, breaking through the 8-week moving average after a short pause. It also broke through and stayed beliow its 21-week moving average. 

I suspect it will either congest or correct in the coming week, but will descend further there after.\

55-week moving average will be the crucial point for Nikkei, since it also coincide with the 61.8% retracement line at 34,396 and 61.8% projection line 33,655. 

It is also interesting to note that there is a divergence on MACD, even though it is a minor one. There is a need for more divergence signal for more certainty. 

In addition, its upward movement seems to follow a 3-wave behavior, giving me the impression that this is a counter wave.

This counter needs to be monitor closely to determine if Nikkei is indeed reversing. 

Labels: , ,

12/24/2022

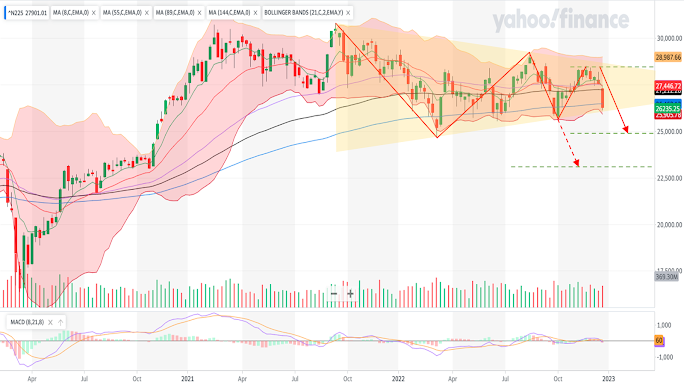
A plunge in Nikkei 225 this week


I have decided to include this entry this week. In my last up-date on Nikkei 225 in After a week's break...... I was still positive on this counter while it was barely supported by the moving averages. It however, surprised the world with a plunged of over 900 points on Tuesday, 20thDecember 2022.

To be frank, I was happily trading this counter in the morning and moved away by 9:00AM. That was part of my strategy. It really took me by surprise when I checked on the market status by 3:00PM. but I do not regret not capturing this plunge, becaussse it is not part of my strategy.

It is due to a surprise move by Bank of Japan to consider relaxing the the tight limit set on their bond yield, leading to possibility of increase in interest rate in future. The move caught the market off guard and thus resulting in the Tuesday's plunge.


Fig 1. Nikkei 225 weekly chart

By the end of the week, Nikkei actually broke as stayed below the 144-week moving average. I estimate that the counter may try to reverse up in the coming week, but may be kept below the belt by the end of the coming week. If this is so, we will see continuation down trend.

Another observation is that Nikkei seems to be in a triangle formation. It has not been broken yet, therefore I will not use this as a gauge for measurement. 

There are 2 formations that enable me to use projection to estimate its support levels. The  first makes use of the top of the major trend and counter trend. However, the down trend here with a gradual slope and to it is not a very good indication for trend reversal confirmation. Giving me a sense that the whole thing might be a counter trend itself.

The support level using projection is between 23,108 to 25,443. 

Base on the more recent fluctuation on the other hand, I can see the more immediate support levels. It surpassed 26,276 and the next level is between 23,921 to 24,901.

If it reverses however,  it will be possible for Nikkei to surpass the previous major high.

What about its currency JPY? After all, interest rate affects currencies much more than others.


Fig 2. JPY weekly chart

Contrary to Nikkei, JPY actually strengthen against USD, meaning that the demand for JPY increased. I have spoken to my brother briefly, he is an accountant. He said it is logical, the demand for JPY and the drop in Nikkei is redirection of JPY for government bond.

What happened here is the drop of JPY (on the chart) is supported by its 55-week moving average, and the moving averages support remain intact.  It is possible a reversal might happen next week, IF  the bar next week tests but ends above the moving average.

For the time being, I will maintain the indication given by the counter. Using projection (again), I estimate the support be between 129.67 to 132.65.

Labels: , , ,