Medtec...waiting for pandemic?
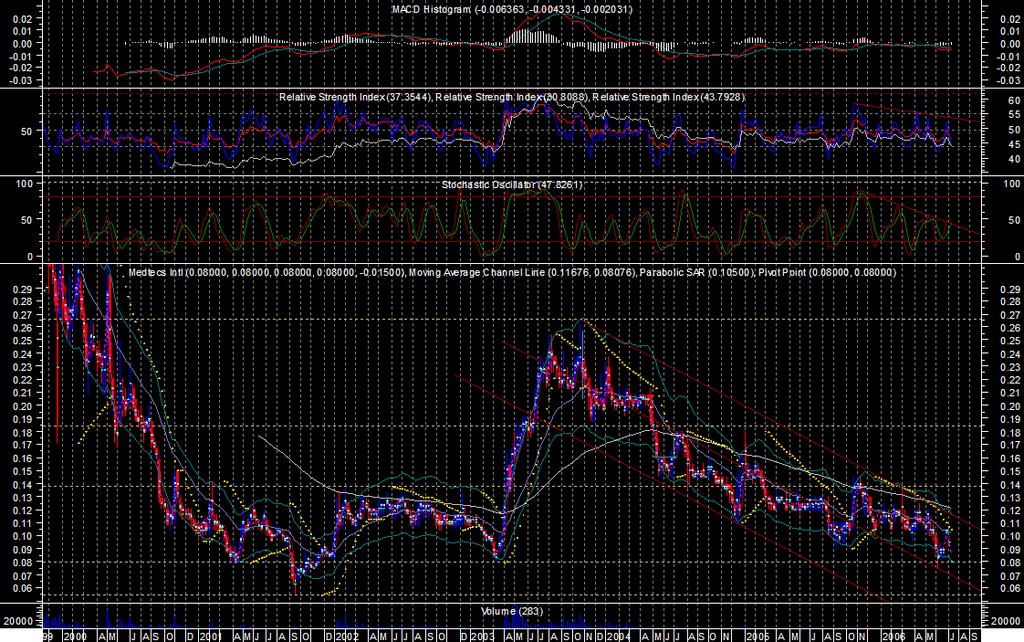 Fig 1. Medtec Weekly Chart
A friend of mine asked me to look at this stock. Since I am studying its general direction, I would check out its weekly chart.
I was not particularly interested in it because it has been very faithfully following the down trend. Neither has the indicator been showing clear sign of buy.
The only thing that might be attracting me now is that this stock seems to bottoming. In recent days it reached the support @0.08. Although little is seen at the indicators, Stochastic does shows some divergence to the price movement. Both moving averages ( 21 and 89 weeks ) are pressing down the stock. So if the stock need a break through, not only it needs to go through both moving averages, it also need to break its trendline, which is now set at 0.111.
Meanwhile, I find it at a risky level of 0.08, which happens to be the support for the low of the past wave. If it breaks downward from 0.08, I feel that it would be time to leave this stock.
posted by denzuko1 @ 12:45 AM
![]()
![]()

0 Comments:
Post a Comment
<< Home