Time of uncertainty
I was quite frustrated with my internet access a few says back as I was not able to log on to my broad band. I was at one point even wondering if there has been a bill payment issue. So it turned out my other phone extension was not fully on hook, so it created a problem during log in. I have only managed to solve this problem yesterday. I was in fact quite eager to look at the chart as it went against my previous prediction, not that it costs me any money.
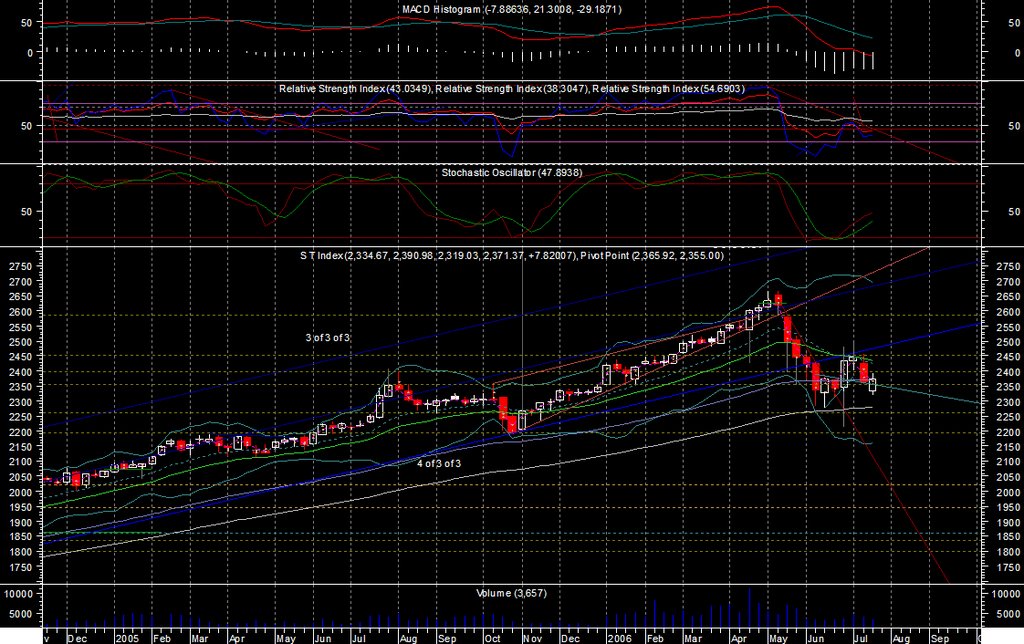
Fig 1 STI Weekly chart
On looking at the weekly chart, I find that if this is a B wave, it is kind of small and narrow as compared to A wave. Through the week, STI tried to move upward only to be blocked by the resistance @ 2,398. This has appeared on my previous message on a few account. Seems to me this is a level to be recon with.
The indicators is also in uncertainty level, Stochasitc is on an up trend while RSI on a reversal down. MACD is also in an indeterminant level. it would be difficult to tell whether it is an up or down trend for the time being basing on indicator.
Looking on a candle stick on the other hand, it does produce a thrusting pattern, indicating a continuation downward. It still needs a confirmation, so the coming week will be the determinant for direction.

Fig2 STI Daily Chart
The B wave looks much bigger than what I have seen in weekly chart, probably due to more details. If I consider the previous upward movement of STI as the A of B wave, this present move would lead to the completion of B of B wave, and we shall see the C of C wave before plunging to C wave. The upward movement during the last few days does seem to support the throry.
Fromw both weekly and daily reading, STI chart tells me of south migration for the coming week. In such case, the support level would be 2,260-2,280. I would consider this position to break down when STI penetrate up ward breaking 2,451.
posted by denzuko1 @ 10:06 PM
![]()
![]()

5 Comments:
If there is a wave c of wave B, 2472 will be an ideal target of bulls based on your lower channcel resistance and retracement of 50% of total loss from 2666 to 2278.
There is no bottom formation dispayed on my radar except HK land (bot 3.82 today, tg 4.20)and FerroChina (bot 0.81 today, tg1.00), which does not support this imagination mentioned above for now at least.
Double bottom formation breakouts increased to 6 stocks on my radar so far, this may be an early sign of market further rebound to a tg of 2472 before wave C can proceed.
Is this rebound so-called wave c of wave B?
Bottom formation breakouts increased to 8 stocks on my radar so far.
I am having similar thoughts as you are right now. I think it could be the C of B right now.
But I need to reflect on my predictions, they are getting less accurate lately.
Btw, I am also not in any position as I will be travelling next week. While I am out, continue to enjoy your trading.
Post a Comment
<< Home