Wave C
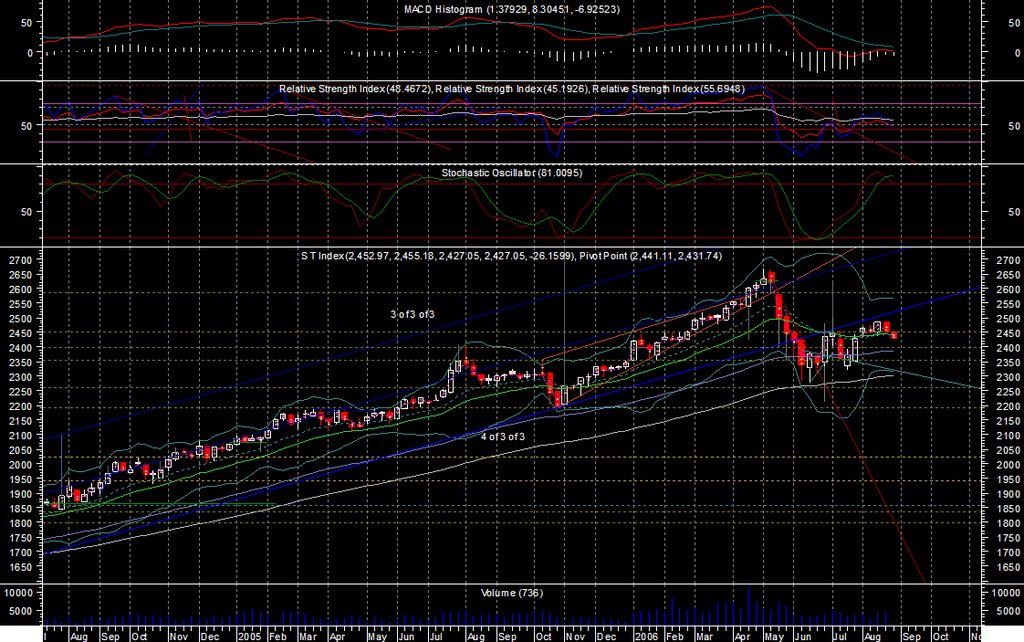
Fig 1 STI Weekly Chart

Fig 2 STI Daily Chart
Judging from my last entry, it must have been a month since I last wrote my blog. No, I was not lazy this time. My wife just gave birth and we have some complication, a symptom known as Amniotic Fluid Embolism which nearly taken her life. It took quite a while for my family to settle back down.
Although I have not seen the chart for quite a while, reading through my last entry does tell me that I did not miss much. Both daily and weekly chart shows that the STI has not managed to break the trend resistance, which was at 2,472 in my last entry and now reciding @2,513. As I was pondering about B wave earlier, I am now seeing the completion of B wave, which itself should be an ABC wave. I would expect the starting of C wave right now if there is no complex B. With 0.618 calculation, C wave should then be reaching 2,245.
The indication of a down trend is not great with the weekly chart as its RSI and Stochastic is just turning downward. The daily chart however, is more prominant. I am seeing divergence on MACD, RSI and Stochasitc.So it is no wonder that STI is now falling. Its nearest support level would be 2,392 while resisting at 2,451. Its time to head south.
posted by denzuko1 @ 12:42 AM
![]()
![]()

1 Comments:
Time to take profit, if any!
Post a Comment
<< Home