Indecision in STI

Fig 1 STI Daily Chart
After my last entry, STI seems to be retreating from its up ward move. It has since continued on its down trend since 7th of September. However, I may see some hessitance in its move as it is reaching a 21-day moving average, I suspect it will be at least temperarily supported at 2,480 with minor rebound before going further down.
RSI and Stochasitc for the chart is also moving south, supporting the down trend. It will be interesting to see STI at 2,474 tomorrow as this will be the test point for the wedge. Will it break this level, thereby initiating the wedge break out to 2,313?
Other than the few levels mentioned, the resistance for STI is 2,519 which is its original up trend trend line.
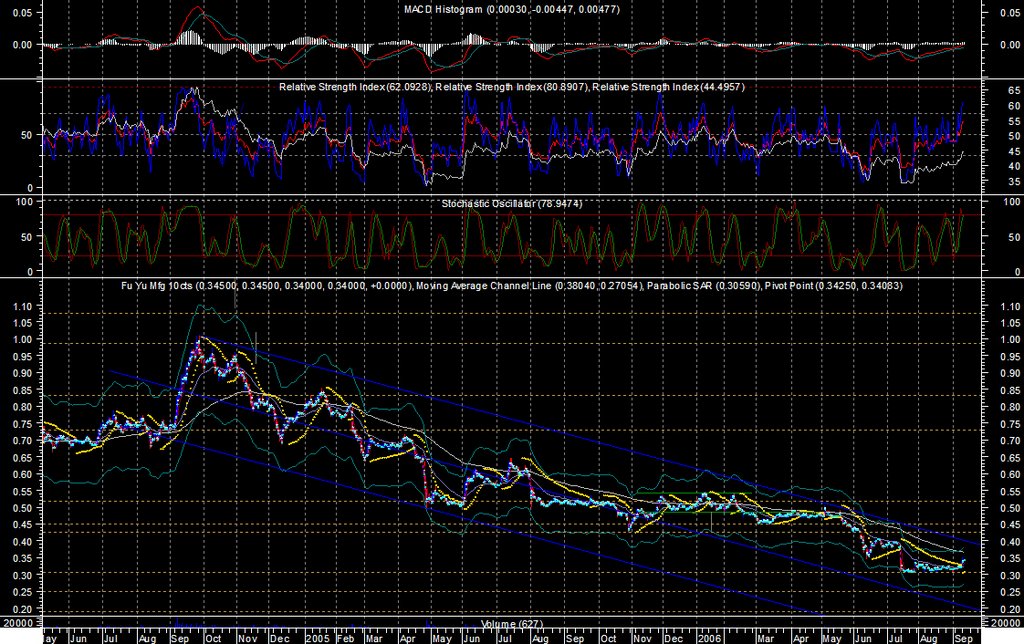
Fig 2. Fuyu Daily chart
While reading the charts, I also come across Fuyu. I have read it a few times before but only today that I find this chart interesting. Simple reason is that its indicators are all having divergence upwards while it hovers at this low point. I feel that there is a chance that it is moving up, base on indications from both daily and weekly indicators. Levels to observe are 0.366 which is its resistance from 89-day moving average, support at 0.305. Its next level of resistance after 0.366 would be 0.425.
posted by denzuko1 @ 10:40 PM
![]()
![]()

0 Comments:
Post a Comment
<< Home