Happy birthday Singapore....and what happened to you?
It is National Day for Singapore today, it is the date that they officially declare independent from Malaysia in 1965. At the time of independence, Singapore has resource except for people. It led the then government to develop the only resource it has for survival.
The result today is a strong and sturdy country with well educated professionals in technical and financial field. The talents of its people are even sort after by multinational companies. Few countries in the world can compete in this area.
The weakness of Singapore is also its strength, a nation of skilled workers. the amount of time spent to develop the skillset leads to a fear of letting go of the rewards that follows. This one fear cause many to stick to their jobs with reluctance to venture into the unknown such as entrepreneurship.
It further that many business owners maintain a traditional mindset, comfortable with where they are and lacks the will power to grow. The goal of these is just to live. Most businesses are stagnant with aim to just service their existing customers.
What of those that grew? Ever notice those listed companies? Remember those who flourished in the 90s and 2000s, like Creative, Aztech, IPC, Venture, JTC and Goldtron?
They are presently only a fraction of their past values, why? Even when they were listed, they maintained the same ownership regardless of their performance. The business owners maintained a firm control over their entities, there was no change in leadership when things go wrong, and companies were filled with people lacking in true skills on company growth while focusing their resource satisfying the narcissistic needs of their bosses.
The government is eager to grow entrepreneurship, they give a lot of support to new start-ups and subsidize industries they intended to grow. However, this also leads to a growth of parasitic companies cannibalizing on government project with little interest in growing beyond government links.
In addition, because Singapore is a country with strong rule of law, it tends to stiffen economy growth. The stock market is one such example, the vase number of restrictions limits speculation, leading to a relatively stagnant market.
Singapore is only ideal for foreign companies who intend to use Singapore as a regional headquarters, with its strong infrastructure and stable environment, it is a suitable place when you just want an environment that just follow instruction.
Anyway, I believe it has been a while since I last look at Singapore market. My last update on SGD was Crude oil is cooling down dated 12th May 2024 while STI in Something is wrong with Straits Time Index (STI) dated 3rd December 2023. While I was confident in the strengthening of SGD against USD, I was negative on STI as there were indications of a market downturn.

Technically, I have not modified the set-up of SGD, the direction of SGD has not changed against USD. However, SGD is still within the congestion zone a this point of time, the crucial level for SGD for its downward movement is 1.31582, it is presently at 1.325.
The downward projections still valid for SGD. SGD crossed 61.8% of its minor projection at 1.32911. It is possible for a correction to above this value before going down further. The next level of support with this projection will be between 1.2899 to 1.3066.
In a more major move, it is yet to reach its 61.8% projection support level at 1.2861.
Together with what I saw on JPY last week and Ruble weeks before, I suspect that it is USD that is weakening in general.
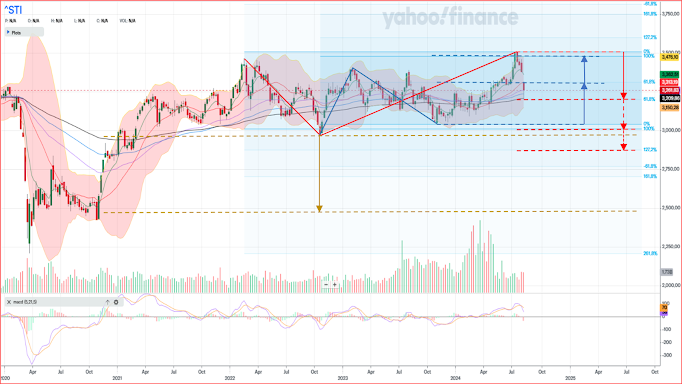
Fig 2. STI weekly chart
what the hell happened to STI?!
The week opened with a steep gap down and there is not enough will power of the counter to even attempt to cover the gap. It opened with resistance from its 21-week moving average, dropped down only to be supported by 144-week moving average at 3,209 and recovered by end of the week to its 55-week moving average at 3,261.
Its MACD has also crossed at this point of time, to some this will be the entry level for short. However, I am a little skeptical, I suspect STI may tried to recover the coming weeks before continuation.
There are a few crucial levels that need attention: 2,968 and 3,041. these are the lows of its downward move. Crossing these levels with more indication of reversal and may mean a double top formation with support zone between 2,475 to 2,633.
However, we are looking at the closer to the present position, It stopped at its 61.8% projection at 3,216. If it crosses this level, the next level of support will be 3,013. This will be very close to the past low.
Just a side track, I received a letter from my broker for Singapore stock, I have not been trading on Singapore market since 2017 and they would close my account if not action by September this year. It caused me to log in to my account to check if there is any share I can trade. I do not really like this as I can only long and not short.
But checking on the counters only led to disappointment, the counters are at the level of cents. it was so tough to even find an active counter that is at tens of cents level. Many even dropped all the way to sub 1 cent. How to trade with this market?
Singapore government love stability, they are uncomfortable with chaos. The stock market on the other thrift on chaos and I think it makes the government irk. SGX will stop and investigate counters with any "abnormal moves". This cause traders reluctant to trade because you can't really make money from a stagnant market.
posted by denzuko1 @ 10:27 AM
0 comments
![]()
![]()


