Google
 
Web thoughts-denzuko1.blogspot.com

My Charting Blog

It is interesting that I start off this Blog when the Singapore Stock Market is heading south. However, this makes it more interesting for me to write on as the market turned volatile. My interest is Technical Analysis, TA for short. I love to look at charts and predicting where they are heading. This blog is or me to record my thoughts on the market. The articles on this blog are based solely on my personal opinion on the charts that I read and readers should not take it as absolute.

12/28/2025

The three little dragons, what is happening to them now?

 I went for a family trip to Taiwan the last week, transiting through Hong Kong.

One might ask " why not fly direct?"

First of all, Hong Kong has been one other our common destination, and the last time my family went there was 2017, the year I got retrenched. Furthermore, lots have changed due to political interference since our last visit, and it is worth witnessing what changed since then.

Second, by transiting, we are able to arrange an overnight stay in Hong Kong, that gives us much time to have a last look at Hong Kong on our last family trip for a long time to come.

Yes, I believe that it will be difficult for us to go on another trip as a family after this. My son is going into National Service (NS) by next year. When his commitment ends in 2 years' time, my daughter will be heading out to the work force. By then, it will be difficult to coincide our time for another round of trip like this.

It was not smooth sailing for this trip though. We started with a flight delay began with 40 minutes, ended with a total of 2 hours wait on the plane, finally departing at 3:15AM in the morning. 

As a result, we landed at Hong Kong Chek Lap Kwok Airport in Hong Kong at close to 8:00AM in the morning, with our next flight departing in around 1/2 an hour time. It led to a mad dash from one far end of the airport, took the transit train through 3 stops toward the other extreme end of the airport. 

We eventually managed to board the flight, but our checked-in luggage failed to do so, only managed to reach us at 10PM after recovered and took the last flight of the day, with much help from the Taiwan Luggage management team at the Taichung Airport. 

The rest of the trip were a walk in the park neither. We walked around 10km per day for 8 days straight. We were all drained out by night, our feet hurt, it was difficult for us to even stand straight, and we ended with difficulty in walking. Nevertheless, it was a fruitful family trip after all. 

So what did I see in Taiwan and Hong Kong? Lots and lots of people, be it on the train, train stations, on the streets and shopping malls. It is just people everywhere. 

There are some different though, the prices. While food and merchandise inTaiwan is quite affordable, Hong Kong is basically see, no touch. Things are VERY expensive in Hong Kong, and this come from me, a person who stays in Singapore, known to be a very expensive place. Hong Kong easily outmatched both Taiwan and Singapore on this.

Taiwan on the other hand has very distinct line on pricing, by city and by classes. Restaurants are in general much pricy while street food is very affordable. Furthermore, its public transport I believe is heavily subsidized, making it very cheap. buses for instance is fixed rate of around 20yuan (less than SGD1.00) per trip. Even thr high speed rail that enable a trip from Taichungin to Taipei in 40 muntes only costs 600yuan (SGD27 per person).

Between Taichung and Taipei. it is about 1:3 in ratio. 3 nights in Taichung cost us SGD300+ while SGD1,000 for a 4-night stay in Taipei. 

On the surface, it hints to me that both Hong Kong and Taiwan are doing well. So the question is: Is this align with their indices?


Fig 1 TWSE monthly chart

I am surprise my last up-date of Taiwan TWSE was Taiwan... on 6th Nov 2013. The blog even lost the attached chart. I mentioned at that point of time that Taiwan was in a worse state than Singapore as it retreated to below the 1998 level, mainly the result of its industrial migration to China, causing a slump in Taiwan economy.   

Since then, Taiwan was making attempt to recover, taking a total of 8 more years. It has it thanks to Covid-19 (remember? The one event that lifted the world out of potential recession by locking everyone up in their own home). Its index is now more than double, reaching new3 high of 28,590 this week.

Taiwan main support to its economy is high tech manufacturing from waffer fabrication to contraction manufacturing supporting major players such as AMD, Nvidia, and Apple. Its focus on technology development gave it an edge over its competitors. 

The index is on a upward climb, but not in the form of 5-wave pattern since the "4th wave" violated the peak of 1st.It is also difficult for me to classify it to be in process of 3rd, because again the"4th" violated the 1st of 3rd.

The main concern here is the climb is at above 65 Degree, very strong momentum and need to be alert as correction can be as sudden. Do far there is no indication of reversal.

At present, I see resistance at between 29,058 to 32,223.

I also assume the data to be correct. While there was a huge dip on week of 20th Apr 2025, it stopped at 55-week monthly support. With such steep climb I believe that it is close to another round of correction. By then, support likely be at 19,738, its present 55-week moving average. My suspicion is that it will be a 3-wave movement lasting a much longer period (congestion).


Fig 2 Hang Seng weekly chart

While I see huge crowd at Taipei main station, it is due to its interchange nature, comprising of high speed rail, Airport transport, MTR and regional train system. Many people transacted through this station. People become scarcer outside this area. Plus, Taiwan public transport may still need improvements.

It is different for Hong Kong, it is people everywhere, be it in the MTR, on the street at the airport, inside the mall, inside small shops. Hong Kong has certainly not lack of visitors.

However, feedback from an Uber driver reflected that a difference on these visitors, which is much different than before. They are less willing to spend. Further observation noted that there are much lesser on the street having Chinese accent, I mean China type of Chinese, unlike my last visit.

True enough, while still planned by the Chinese ruling party from Beijing, this round of officials behaves differently as compared to the las, led by Carrie Lam, a blind follower of the Chinese communist leadership with anxiety to please. Indeed Carrie Lam is sinner of thousand past for Hong Kong, single handedly destroying the whole territory.

The present batch lead by John Lee focuses less on pleasing his master in Beijing, instead doing his best to revive the Hong Kong economy, which was damaged by Carrie Lam. While his team seemingly lacks competency in improving the situation, I believe they are doing their best.

The damage is done, my wife and I notice the different. Hong Kong seems to lack the drive we used to experience. They seem to be less hopeful of the future. A walk on the streets also noted the closing of small and medium retails. What in place is demolishment of old shop houses to amass a much larger plot o land to build a bigger infrastructure. Gone are the neon lights which gives Hong Kong its title of being the pearl of the east. 

My hope is that Hong Kong is left to heal itself. After master mind the destruction of Hong Kong, Xi seems set interest on another project, that is the destruction o Hainan Island (he seems to have a innert dislike to prospering area of China). Just hope that he leaves Hong Kong alone.

So what does the index say?

My last update on Hang Seng was in surprise! My condolance to charlie Kirk dated April 2025. 

It is quite interesting that I felt there was limited upside then. It managed to climb higher, but mildly, and congested after that. I believe that it is about to correct with support at its 55-week moving average presently at 23,944.

In my last analysis, I used projection to estimate its resistance. This time round, I assume a break out f its double bottom and utilize extension to predict a positive objective. 

It is presently close to its 61.8% extension of 27,724, which it will face further resistance. Breaking through this, its double bottom minimum objective should be 30,799.

his contradict my past prediction that was bearish in nature based on its multi-year double top formation. There is still a certain level of resilient in Hong Kong, it is not ready to die of. 

But again, it really need to be less dependent on China and open up more to the world. 


Fig 3 STI weekly chart

I really can't believe that after so many years, Singapore STI is still at the level of thousands.

this is probably due to the demography different of Singapore, with its people strength in management and organization management. As such it attracts MNCs to build regional office partially due to its high level of proficiency in English.

In addition, there is less uncertainty in Singapore where it is leaning more towards the west, as compared to Hong Kong and Taiwan. While Taiwan is eager align itself more with the west, it however, is not as proficient in English as compared to Singapore.

Howeve, I believe Singapore is not a place to amass capital, since its stock market is highly regulated, making it more challenging for its stock market to fluctuate. the government objective is stability, as such fluctuation in the stock market is an uncomfortable stimulus to the authority, especially after the tromour of 1996 attack by Soros.

Unlike Hong Kong with main focus on properties and tis stock market, or Taiwan with its dominance in electronics, Singapore economy is actually very diversified. It may surprise people that Singapore is a huge exporter in furniture, ornamental fishes and even coffee. This on top of its main contributor in oil refinery, port service, air hub, biomedical and electronics.

What of the index?

It's STI is on a gradual climb, very different from that of Taiwan TWSE and hong Kong Hang Seng. At present, there no signal of reversal, neither is there divergence.

At this point of time, I see resistance at 4,688, with support 4,499. China announcement of creating free trade port in Hainan does not seem to affect its climb and i is still reaching higher high.


Labels: , , ,

6/08/2025

Singapore Election is over, and I have yet to do a market reaction....

It has already been a few weeks since the Singapore Election. It was relatively a big fuzz, not because of the new leadership, but more of the Gerrymandering of election territory, in favor of the ruling party, as well as the parachuting of paper generals from the military, as well as insertion of controversial candidate from the ruling party side.

It is not the first time that Gerrymandering happens in Singapore, neither is the parachuting of the "generals".  For long, the ruling party has been using Group Representative Constituency (GRC) as a form of barrier to opposition entrance to the political arena, it started with partnership of 2 "to ensure representation of minority race". It then expanded to 4 a group claiming a better servicing of its people, but with effect of protection to ensure its new candidates can penetrate into the parliament in safety.

This is when we see generals untested in the political arena resigned from their posts and joined the ruling party, participating in election and became a member of parliament. There is little need for these candidates to fight hard through election process to demonstrate their worth to the people.

Much news is made to demonstrate the leader of the ruling party, Lawrence Wong as a people person, with much of it having him surrounded by people wherever he went. I, however, is skeptical of his leadership. What has he done for Singapore so far?

He has yet to prove himself as far as I am concern. 

Yet, is this my personal opinion of there are others who share my view?

|I still recall many years ago when Lee Kwan Yew (LKY) was still the minister mentor of the country, it went through a round of election and the market surged the Monday after the result shown that the ruling party was back in power. 

LKY came out in the news commented that the ruling party was the right party for the country, so much so that even the market agreed with the result.

Guess what? The market tumbled for 2 weeks right after, this followed by the reversal of world into a bear market.

Not that the Singapore market being a leading indicator of world market, it is not. But the market will be in euphoric mood after result release and will revert back to its general trend right after. The political effect is short term while the economic effect is long.

What's more important is what action the ruling party is taking that is important.

So is the market supporting the ruling party this round?


Fig 1. STI weekly chart

The election took place on 3rd May 2025, so we need to see the market reaction on 5th May, 2025.

The market went up, but there was no euphoria. There is no excitement this round. While the market opened gapped up in the following week, it retracted all the way back fully recovering the gap. 

This is not a very good sign.

Even though the market continued to inch up the weeks following the correction, it lacks momentum and yet to cross the previous high of 4,005 on week of 12th May 2025.

More immediately, I anticipate a continuation upward but with difficulty. I will be looking for a breakout upward which based on my experience may be sign of exhaustion before it starts its descent. I suspect the Bollinger band which is presently at 4,047 to be its resistance level.

Of course, it is also possible that the uptrend of STI is yet to complete, and it is present in a correction phrase. Since the same apply to its uptrend is fully recovered its downward gap as a result of Trump's tariff. As such I might find support of this correction at 3,690. This is also very close to its 61.8% projection support, which present coincide with its 89-week moving average.

What if it breaks its previous top and continues upward?

The most immediate resistance will be its 61.8% projection at 4,215, this followed by 4,437, which is the 100% projection.

I think the more probable scenario is still having STI stopped by its previous top or Bollinger band before it begins its next phase of descent, In the long run, it may even go further than its 100% projection. 

Why I think so?

It has to do with the MACD indication. it has been showing divergence to the uptrend of STI. I believe STI is in the early phase of decline.

What's of the Singapore's situation, then?

For quite a which I have not sense a firm leadership in the government. There seems a lack in direction. Further what more can you say about a ruling party with more focus on fixing the oppositions instead of leading the country?

The ruling party is on deterioration. Worse for Singapore is that for so many years, there is not one credible opposition that can take over the ruling party which it is failing. the people have for so long been depending on the government for stability and lacks self-initiation for improvement. The people need to learn about self-sustainability and reduce their dependency.

Labels:

8/09/2024

Happy birthday Singapore....and what happened to you?

 It is National Day for Singapore today, it is the date that they officially declare independent from Malaysia in 1965. At the time of independence, Singapore has resource except for people. It led the then government to develop the only resource it has for survival.

The result today is a strong and sturdy country with well educated professionals in technical and financial field. The talents of its people are even sort after by multinational companies. Few countries in the world can compete in this area.

The weakness of Singapore is also its strength, a nation of skilled workers. the amount of time spent to develop the skillset leads to a fear of letting go of the rewards that follows. This one fear cause many to stick to their jobs with reluctance to venture into the unknown such as entrepreneurship.

It further that many business owners maintain a traditional mindset, comfortable with where they are and lacks the will power to grow. The goal of these is just to live. Most businesses are stagnant with aim to just service their existing customers.

What of those that grew? Ever notice those listed companies? Remember those who flourished in the 90s and 2000s, like Creative, Aztech, IPC, Venture, JTC and Goldtron?

They are presently only a fraction of their past values, why? Even when they were listed, they maintained the same ownership regardless of their performance. The business owners maintained a firm control over their entities, there was no change in leadership when things go wrong, and companies were filled with people lacking in true skills on company growth while focusing their resource satisfying the narcissistic needs of their bosses.

The government is eager to grow entrepreneurship, they give a lot of support to new start-ups and subsidize industries they intended to grow. However, this also leads to a growth of parasitic companies cannibalizing on government project with little interest in growing beyond government links. 

In addition, because Singapore is a country with strong rule of law, it tends to stiffen economy growth. The stock market is one such example, the vase number of restrictions limits speculation, leading to a relatively stagnant market.

Singapore is only ideal for foreign companies who intend to use Singapore as a regional headquarters, with its strong infrastructure and stable environment, it is a suitable place when you just want an environment that just follow instruction.

Anyway, I believe it has been a while since I last look at Singapore market. My last update on SGD was Crude oil is cooling down dated 12th May 2024 while STI in Something is wrong with Straits Time Index (STI) dated 3rd December 2023. While I was confident in the strengthening of SGD against USD, I was negative on STI as there were indications of a market downturn.


 Fig 1. SGD weekly chart

Technically, I have not modified the set-up of SGD, the direction of SGD has not changed against USD. However, SGD is still within the congestion zone a this point of time, the crucial level for SGD for its downward movement is 1.31582, it is presently at 1.325.

The downward projections still valid for SGD. SGD crossed 61.8% of its minor projection at 1.32911. It is possible for a correction to above this value before going down further. The next level of support with this projection will be between 1.2899 to 1.3066.

In a more major move, it is yet to reach its 61.8% projection support level at 1.2861. 

Together with what I saw on JPY last week and Ruble weeks before, I suspect that it is USD that is weakening in general.


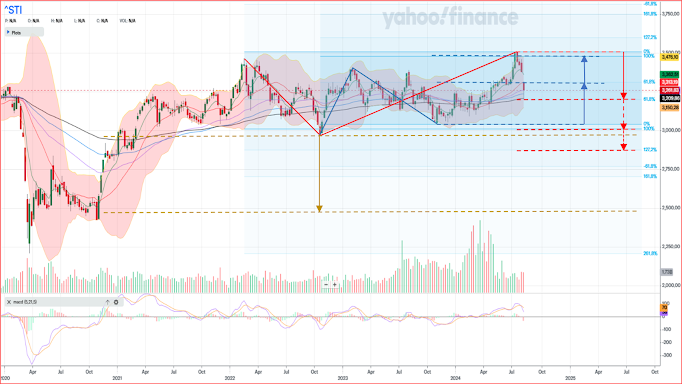
Fig 2. STI weekly chart

what the hell happened to STI?!

The week opened with a steep gap down and there is not enough will power of the counter to even attempt to cover the gap. It opened with resistance from its 21-week moving average, dropped down only to be supported by 144-week moving average at 3,209 and recovered by end of the week to its 55-week moving average at 3,261. 

Its MACD has also crossed at this point of time, to some this will be the entry level for short. However, I am a little skeptical, I suspect STI may tried to recover the coming weeks before continuation. 

There are a few crucial levels that need attention: 2,968 and 3,041. these are the lows of its downward move. Crossing these levels with more indication of reversal and may mean a double top formation with support zone between 2,475 to 2,633.

However, we are looking at the closer to the present position, It stopped at its 61.8% projection at 3,216. If it crosses this level, the next level of support will be 3,013. This will be very close to the past low.

Just a side track, I received a letter from my broker for Singapore stock, I have not been trading on Singapore market since 2017 and they would close my account if not action by September this year. It caused me to log in to my account to check if there is any share I can trade. I do not really like this as I can only long and not short.

But checking on the counters only led to disappointment, the counters are at the level of cents. it was so tough to even find an active counter that is at tens of cents level. Many even dropped all the way to sub 1 cent. How to trade with this market?

Singapore government love stability, they are uncomfortable with chaos. The stock market on the other thrift on chaos and I think it makes the government irk. SGX will stop and investigate counters with any "abnormal moves". This cause traders reluctant to trade because you can't really make money from a stagnant market.

Labels: , ,

12/03/2023

Something is wrong with Straits Time Index (STI)

 I am relatively relaxed today, I have completed my weekend tasks yesterday, including an entry to this blog. 

I woke up early this morning and practiced my sketching skill set, I just kept experimenting on figure drawings, training myself from sketch of single person to 2-person interaction. 

By 10AM, I felt that I have done enough of my sketches, and it would be good to do something else.

I have decided to turn on my laptop and aimlessly checking on charts. A thought came into my mind, " maybe I should take a look at STI."

I seached through my archive and was surprised that my last input for STI was One refuse to go down, one refuse to go up... in February 2021. That was more than 2 years ago!

In that update, I estimated an uptrend for STI with an objective of above 3,500.

I never thought that I should be surprised by the STI chart, except that I was.

Fig 1. STI weekly chart

To start with, while STI climbed up north since then. it failed to reach 3,500 and stopped shoert of crossing the previous high of 3,466, only to manage 3,408. All these whiles, divergence was observed on MACD with lower high on every single peak from STI.

 Started with its gap on 21st March 2021, STI has in fact gone side trend and forming what looks like and island reversal pattern with a potential double top reversal with a neckline at 2,968. 

What's more alarming is its recend decline since 30th Jul 2023 from its peak of 3,392, that came with a surge in trade volume. Even though the peak volume was observed on its reversal from the moving averages, that surge of volume did not translate to momentum upward.

Instead a larger volume on its decline seems more consistent.

This formation is 3 years in the making, quite consistent with the time needed for a top or bottom formation.

As of this week, there are 2 moving average crossing noted, the 55-week crossing 89-week and 21-week crossed the 144-week. 

Things are not looking good for Singapore if STI enters bear market. Evidence from its previous major declines, the slope of bear for STI is very steep.

If this is true, I suspect Singapore will enter another round of recession for the next few years. Tough time will however, not be felt in 2024 as STI has just begun to fall, it will be at the bottom off fall when the market feel the pinch.


Labels:

2/21/2023

One refuse to go down, one refuse to go up...

I mentioned in my entry last week that I will be up-dating the HSI, DJIA and Nikkei. IT did not happen. However, it is not because I am lazy, I am simply uncertain about the conflicting signals on the 3 charts. 

When I looked at the currency charts, apparently USD seems to have reversed upward, strengthening against all other currencies. I will need an additional week to confirm this.

As a result, I could not figure out what to up-date.

Glancing through my portfolio of interest, I came across 2 charts, STI and KLSE (KLCI). These 2 seems to be going in the opposite direction, one refuse to go up, while the other refuse to go down.


Fig 1. STI weekly chart 

The lock down stopped the descend of STI in 2020 and its recovery continued till 2022. While seemingly reversing down, it did not reach the intended objective and reversed back up due to support from the Bollinger band envelop.

It congested momentarily after breaking through the moving averages made further headway before coming back to retest the 8- and 21-week moving average. I suspect this is due to the resistance at 78.6% retracement line, the same resistance stopping the up-thrust of STI in 2022.

Nevertheless, the moving averages are all climbing upward, supporting the continuation of STI up-ward. STI is in fact very close to its previous high in 2022.


Fig 2. KLCI weekly chart

The recovery of KLCI since 2020 is much weaker and the momentum depleted even before 2021. It retested the trendline and retreated in 2022. It is presently getting close to the same trendline again.

While there is a projection measurement indicating a huge advance up-ward, at the same time, a more minor projection indicates continuation downward.

I feel that while there is indication of up-trend, there might still be more down trend before its reversal. Partly because the moving averages are in alignment of down trend.

Labels: , ,

8/20/2022

Are we in a bear market already?

 While surfing on youtube.com recently ( Yes, I still use surfing, I am THAT OLD ), I have come across a few advertisements about training programs on trading. 

The spoke persons are normally young with attempts to demonstrate how successful they are in trading. 

I have seen the guy's advertisement before, he sat on a beach bench next to a swimming pool and the first thing came from his mouth was" stop buying stock!" I clicked "skip" straight away.

The woman on the other hand talked about the seminars she conducted and tried featuring some successful students of hers. She even featured a trip she made oversea while still making money. 

Both promoting trading using options, claiming that this is also the same strategy used by Warren Buffet.

What they are reluctant to show is that to be successful in trading, you have to first experience failure to prepare those people thinking of entering the market. 

They all come with a single message this time, " we are in a bear market..".

The message puzzles me, are we seriously in the bear market?

Let's bring in a reversal scenario from the past, the one I get to know when I first met technical analysis, the Strait Times Index.


Fig 1. STI Weekly Chart from 1992 to 2003

I have purposely pulled out the period between 1992 till 2003. That is the period when we encountered the Asean market euphoria, the Asia financial crisis, US Enron and Worldcom scandal between 2001 and 2002.

This is where we see signs of reversal starting with steep climb of above 60o angle, top formations that last 2 to 3 years before breaking the neckline before we can claim that it is a bear market, as can be seen from the chart in Fig 1. You will also notice a larger fluctuation of individual bars, overlapping each other.

I believe the speakers in the advertisements are referring to US market. So let's take a look at Dow Jones Industrial Index ( DJIA) to see if all these signs are present?

Fig 2. DJIA Weekly Chart

In DJIA, I see a steep climb and patterns of erratic movements with bars overlapping each other. However, I have not yet seen the completion of top formation, neither am I seeing signals indicating a reversal behavior such as a failure or non-failure swing.

Further more, after the recent reversal from the 89-week moving average, DJIA is seen creeping upward with momentum. In my earlier article Dow Jones, Hang Seng & Nikkei Up-dates - 13/8/2022, I am still bullish on this index ( with some reservation ). 

I can't use the formation in 2021 to determine a reversal and confirmation of a bear market, the double top in 2002 have already met its minimum objective.

There is still some way to go for top formation, DJIA might still go higher or congest to complete the pattern. 

Having said that, when was the most recent bear for Singapore STI?


Fig 3. STI weekly Chart

I have not been on STI for a while as I am not trading this index, and I have to admit that I am a little surprised to see this on STI. 

A top formation completed between  2017 to 2020 and it was on a free fall after that. If not for the lock down in March 2020, I can't imagine how low it would have gone. If lock down have not happened, the government would not know what to say about how the market could become so bad. No wonder they were so desperate to conduct the election in the midst of a pandemic lock down. 

The problem that I see with STI now is the similarity it has with the period of 1998 to 2002 ( refer to Fig 1.), a sharp plunge, recovered but failed to hit previous high. What followed  was a second recession until 2002, 911 and invasion of Iraq led to a slow market recovery till 2008 ending with the Lehman Brothers bankruptcy.

Will the same happen this round with a top formation till end 2022 or 2023, then another recession takes place?


Labels: ,

3/16/2011

What a GREAT move....

I am not going to blame myself for abstenance from blogging for quite a while. I was busy, rushing to complete the tasks meant for the coming seminar at Penang by the end of the month.

I am quite busy today first with trying to send the demonstration kits to my colleagues in Thailand and Penang. It took me 1/2 a day to do so because of errors here and there. Then there is this afternoon meeting for the department. What is strange to me all these while is that my boss gets me and my colleague to present to our own people.

It was much later then I realize how much the market dropped, and I have no idea until I saw the charts. So may be it is a good idea not to read my charts too often as it corrupts the BIG picture.


Fig 1 STI Daily Chart

STI has fallen much, thanks to Japan's earthquake and Nuclear explosion. In fact, the earthquake didn't do much, it is the Nuclear explosion that gave the killing blow. It is quite rare to see Nikkei fallen by more than 1,000 points, but I have seen STI dropped by 90 points before.

STI has met its minimum object and went further, my prediction came true. It is now still holding onto the negative gradient of the Gann Grid lind but it is coming close to the apex, so its decision time soon, will STI reverse up?

One thing that I laugh about is the comments from the analyst talking about global economical melt down, they even talk about Singapore economy heading for bear market when STI hits 2,700+ level. Even my boss took out an article today detailing how much potential business losses from this earthquake. I won't want to say it up front, but I disagree.

It is not that we will in bear market at 2,700. I am sure we are already in one now considering my daily moving averages have already crossed. In addition, I am seeing this present move from 24th Feb to 9th Mar as the 4th wave, meaning we are in the fifth wave DOWN now. There will be more to come.

But will it be VEY BAD? Let's see, a 23.6% Fibonacci projection downward will lead to around 2,898. I think that will be the end of fifth, if not, 2,853 which is the 38.2% Fibonacci projection. This will complete either the C of a 3 waves pattern or 3rd of the 5 wave pattern.

Economically, a disaster is an economical event. The destruction means the need for replenishment, demand for goods increases especially when the scale of destruction is so great. I would see it as opportunity.

The scary part of course is the US treasury Bonds. 10 years ago, my teacher ever told me that Japan was the biggest buyer.There was this once USA pissed japan off and when it was trying to sell its bonds, they was no buyers, Japan sat on the fence.

If Japan lacks the money to rebuild, it might end up forced to sell the bonds. This will get the US economy to its knees and probably a bear market in USA.

So let's just hope that Japan has enough money.

Labels:

3/08/2011

Another low in my life...

I was off reading charts the whole week, I was not in the mood. It seems like when bad things appear, they come in waves.

First I have hypertension and was conned into taking Beta Nicardia, resulting in:

1) pain on the back neck muscle;
2) Weak joints in particular at shoulder area;
3) Lartagidy, lack of energy after lunch;
4) Light headedness, will floating sensation (can't say I hate this because it is like on drugs);
5) Frequent headaches;

The worst effect was when I wanted to stop the medication, I experienced palpitation, with strong and quick heart pump. It took me a week to overcome the withdrawal syndrome. Mean while, I continued to experience the side effect of the medication.

Just last week, I received bad news from home, my grand mother died. While she lived until the age of 99, her last few years on earth was not good, she got dementia, difficulty in walking, put to an old folks home. She has 6 sons and none of them wanted her in. It dawn onto me that both my Grandmothers and my "maternal grandfather" have their end of lives spent in old folks home. Is this the trend nowadays where old folks are classified as useless and non-contributors?

Anyway, I manage to control my hypertension through alternate means, although it still fluctuates, it nevertheless less serious than the time when I was measured by THAT doctor.

I also have rewards on my trip back to Malaysia this round, there are a lot more juicy tales about my Grandmother that I did not know earlier. I also come to believe that my mother has conflict in herself about her feelings about my grand mother. There is a part of her hating her mother and yet there is another part which gave her fond memory.

Both my mother and grand mother shared the same birthday. She told the family during the funeral about this time when she was 9 or 10 years old. It was nighttime and she was helping my grand mother to sew the buttons for customers in bed. They rented a small room and they sheared the room with my 3 uncles. My grand mother said, " if later on the fried kuey Tiao man come, let's buy a pack of char kuey tiao. afterall, it is aour birthday." They waited, but the man never appeared. It was fated that they were never able to celebrate that birthday of theirs.

When my mother told this story, I could sense her disappointment in the story, it was not the missing kuey tiao, but not able to do something common with her mother. I felt a sense of sadness in her because it was a missed opportunity.

I had my fair share of relationship with my grandmother, afterall, she took care of me since I was born. I lived in an unstable environment then, both my parents had to work and there was not one to take care of me permanantly. My grand mother suggested to my mother that she will take care of me and my brothers while she worked. That not only gave me a place to settle down, it also saved my brother from being aborted.

It was unfortunately my life with my grandmother was discontinued at 6 when my mother and grand mother broke ties after an arguement. My grandmother of course has her evil side, but nevetheless, she cared for me. I still remember the few times she took me to see the doctor when I was sick. It was not easy considering we have to take 1 hour of bus just to reach the clinic, doctors then were not a common sight.

I missed my grandmother, that makes me think that I need to treasure my love ones more because all of us are not going to be around forever. One day, we will leave this earth. It will be too late to mend anything by then.


Fig 1 STI Weekly Chart

Speaking of STI, it has been up since last Friday and this week, it continues to move north! I won't ask what happened because that is a fundamental question, mostly. Technically speaking, it is time for rebound.

However, my guess is that its northward movement is limited because it is coming to a resistance, I believe relatively strong resistance. It is the neckline of the double top at 3,118. Not only that, there is also 21 weeks moving average at 2,123, 50% Fibonacci retracement resistance at 3,114.

On a positive end, both Stochastic and RSI are at the bottom and reversed, at the same time Gann Grid gradient is positive. These are indicators of bullishness.

The signals are mixed, which one should I follow? My gut feel is: STI will be going down, still.

Labels:

2/22/2011

Fighting Hypertension

I have been a little lapse on my charting lately. I have earlier on mentioned of having hypertension and on medication. It was a life changing experience for me. Lately I am experiencing the negativity of the drug that I have taken, migrains, weak muscle especially the upper arms area, sleepiness and easily letargic. My heart beat has been especially sloooooowwwww lately, below the 60 pulse level while blood pressure looks okay.

Turn out the drug known as beta blockers works in the way of reducing the heart beat to control the blood pressure. But the side effects definitely is worse, worst is that the drug is not a cure but a controlling agent. The blood pressure will again shoot up once you stop for 2 to 3 days.

Since then I have been researching any altrernate ways to tackle the issue. Seems like I need to pump up my exercise routine and watch my diet. It is made worse because I am a salt person, and I need to remove all sodium contents from my diet. Well, we will see how it goes.


Fig 1 STI Daily Chart

Speaking of Beta Blocker, STI certainly seems to have taken the same medication as I have. I recall my last entry that it is heading down, and it is.

Placing a Fibonacci Projection at second wave and third wave, level of support and resistance is derived at 3,009 and 3,044 respective. While I expect it to fall, the plunge ( with gap down ) is much more dramatic than I have thought.Not only the previous high failed to support the index, it is now the resistance.

Base on Gann Grid line, there might still be some distance to go. Next support level is 2,910 other than the Fibonacci's.

In longer term, STI does not look good, the 21 days moving average has just crossed the 89 days'. It kind of signifies the beginning of the end.

The funny thing is that Goh Chok Tong just mentioned on news that there is no U-turn on growth policy, not that I don't support. The thing is that STI does not agree with the policy and it is doing a U-Turn on its growth now.

Labels:

2/15/2011

How right am I?

You can get it wrong many times when you do charting, but when you are right, it feels like you have won a million. So I was right about these 2 days, I mentioned that Monday should be up but short lived. In fact Monday's rise of STI was only stopped by the neckline and today it has lost all its gain, went even lower than Friday's low.


Fig 1 STI Daily Chart

Now I am in a mild dilema, both indicators are in conflict with each other. Stochastic is reversing down while RSI up. What's in common is that they are both at the bottom. Another issue arise, STI is touching the positive gradient of the Gann Gird line while weekly chart touching the negative part.

This time I am making an educated guess base on probability. It will be up tomorrow when I consider the 4th wave of the this third wave. It could be irregular pattern so we will see a rebound up tomorrow (probably to the neckline again. This would be before it breaks through the Gann Grid and continue to move south once more. If on the other hand STI is in such a weak condition, it will break right through the Gann Grid tomorrow. A stronger rebound will come after the completion of the fifth.

In anyway, we should not be in the market now unless it breaks 3,118. That will render the double top invalid and instead indicating the possibility of the completion of the counter wave.

Labels:

2/12/2011

Correction coming....

My son came down with a fever with cough. It was expected because the flu virus has been passing around the family and that he has taken a lot of heaty stuffs during CNY. We were actually anticipating this to happen. So it is again sleepless nights with scheduled medication in the middle of the night.

The only thing that I find strange is that he still has so much energy to play and enjoy himself. I recall when I was having fever as a child, it was quite hard to even walk, let alone play.


Fig 1 STI Weekly Chart

So STI went down one more time on Friday. The lucky thing is that it met with a resistance (previous high) of 3,052.62 and rebounded. It is also quite clear that it broke through the neckline of a double top which took 4 months to create. Assuming that it does not violate the rules again, the minimum objective of the double top is 2,945.


Fig 2 STI Daily Chart

On daily basis,it clearly show a 5 days drop and it broke through the 21 and 89 days moving averages. Moreover, it has also broken the long term trendline (quite some time ago). Its not a good sign so far.

The good part is that both RSI and stochastic is at the bottom which is an indication of over sold. So a rebound is due.


Fig 3 STI Daily line chart

I purposely add in the line chart this time, because it reveals a something different. What happened on 8th Feb 2011 caused a slow down in its descent. I have seen this kind of thing before. It is micro wave and the pause on the line indicated a counter wave. So what is the significance?

What I think is that the counter wave is a 2nd wave and it is followed by a 3rd wave. If this is so, 4th wave is next. So Monday is likely to be up but not for long and it tends to be irregular for a few days. It will follow by the 5th wave.

On a bigger picture, we could be well into the C wave of the whole counter wave pattern. Nov 2010 was A wave, Nov 2010 to 19th Jan 2011 is a B and now we are in the middle of C. The completion of the coming 5th wave only marks the completion of the 3rd of C wave, there will still be a 4th and 5th.

Labels:

2/10/2011

Not a very happy CNY

I haven't been reading charts the last few days, my hypertension condition is ringing very loudly in my head, plus, my cough is not completely healed and it turned into a flu. My wife, my son and daughter are also catching the cough from me *sigh*. I am also having this neck pain since my return, it is strange as it is not the problem from the joints of my spine.The pain leads to headache.

The last few days have been quite chaotic, trying to adjust back to normal life. I have not been reading the charts since I was back from KL on Sunday, the notebook was dismentled from the system and I need to reconnect all the wires to get it operational.


Fig 1 STI Weekly Chart

Looking at STI, it is certainly not a good start for CNY. Coincidentally, I read my past 2 posts and noted that both posting contradict each other. It seems like the wave count at the moment is more reliable than the indicators. Like the earlier posting, there is more down side.

What interesting is the STI has now broken the double top neckline, as a respect for the pattern, the measurement of minimum objective is 2,969. STI also broke through the 21 weeks moving average at 3,150 which now become the resistance. Its 89 moving average on the other hand is supporting the index at 2,898.

On weekly basis, RSI and Stochastic is heading south, and it seems like this is only the beginning. Another point to note is STI is leaning towards the negative gradient of the Gann Grid line, so it is likely to move southward.

As for tomorrow,well, on daily basis, the indicators are already at the bottom, there might be rebound. If we believe in Fibonacci on the other hand, the next natural number is 5, so it is less liely to have a 4-day trend,the fifth is likely to be a down as well.

Labels:

1/26/2011

Breakaway candlestick

I have started my Qi Gong routine again as a way to counter the hypertension issue. It has been some time since I did this. due to time constraint, I focus on the big and small heavenly circle with the whole body "massaging" (done by myself). I am not too sure of the result yet.

One more thing I noticed is that the blood pressure on my left and right hand is different! The right hand's pressure is about 10 steps higher than my left, so which should I trust?


Fig 1 STI Daily Chart

Speaking of STI, my update last night was a flag with downward pressure. It seems that STI is not yet ready to go down. The up-ward movement today formed a Breakaway pattern under candle stick. The only short fall of this pattern is that you need confirmation. So we need STI to go higher tomorrow.

The move is supported by the up-thrust of the indicators, both RSI and Stochastic are heading north, most likely this time, they don't want to show divergence.

Labels:

1/25/2011

Continuation

I am referring to my cough. It seems that after more than 1 week, 4 rounds of doctor (inclusive of one Chinese sensei), I am still coughing. I just wonder how I can get rid of my cough. I am still coughing every now and then, although it is not as serious as earlier times, it is still irritating.

As for the blood pressure, I did some read up on the issue. The one very reason why one cannot stop the medication is because no one knows if the normalization of the blood pressure is due to the drug taken or body healing. Therefore there is a tendency that the blood pressure will shoot up if medication is stopped and as a result danger of stroke.

I have talked to a colleague today, I estimated that he is a likely candidate of hypertension because of his obessity, of which I am correct. He mentioned that he did made a stop for the medication for about 1/2 year once. But there is a strange feeling (which I did not verify) and a sense of danger on his health caused him to start taking the medicine again.

So if I am to stop the medication, the first step is to find ways to really reduce the hypertension, take the remedy with the drug simultaneously and then slowly substitute the drug with the remedy. It will take a while for this to happen and I have put my plan into action only after CNY.


Fig 1 STI Daily Chart

It has been a while since I last read a chart (since last week), there were some lost data between 1st of Jan to 12th Jan 2011. I am not sure what happened during that period and I am hoping that it is a flat instead of protruding up, it will make quite a difference in terms of wave count.

So far, I see that both RSI and Stochastic is at the bottom and they are about to turn. But if I base on the theory, strictly speaking, I still need divergence for confirmation.

The pattern it is developing on the other hand, looks very like a downward flag, and this would mean a continuation to 3,146. Basing on wave count, this would be a "c" wave.The objective coincide with the present position of the 89 days moving average.

Just a spare thought on the issue. If base on my original estimate of wave count, we should be in a major C by now. If this is true, what's happening now is only the tip of the iceberg, there are more downside to come.

Labels:

1/06/2011

...and I thought the worst is over....

No, it is not the market I am referring to. Its my daughter's education. I thought that the most important part is to get my daughter into a good school. well, I was wrong, because my nightmare just started.

WE have just received a stack of message from the school board and the alumni. We are to meet the teachers on 22nd Jan 2011 (Saturday) and being encouraged to enroll our kids into enrichment class for Mandarin and English (for Saturday) and the greatest part is that its going to take the whole afternoon! Seems like there is no way we are going to rest on Saturday. The lucky part is that my daughter loves attending classes, I don't know why but I find her being very happy going to classes. I doubt my son be the same, he is the type who loves to be free.


Fig 1 STI Daily Chart

What I see on STI chart today is something called the separating lines (Candle Stick). This is a bullish continuation pattern and will need confirmation (higher highs tomorrow). What's more, today mark the crossing of the double bottom neckline, seems like it is going to be bullish for quite a while still.

Labels:

1/04/2011

A Transition in life

I have not up-date my blog for a while, this is because there is a small transition in my life. Well, the passing of 2010 means I am one year older, but this is not the transition I have.

My daughter is entering Primary 1!

Today is the official day my daughter starts her primary 1 life. It is a transition not only for her, but also for me and my wife. Things will be different from now on. No more chance of taking a vacation during low season.

The transition however, makes me feel older. I am also come to realisation that its probably time to make some changes in my life.


Fig 1 STI Daily Chart

STI did not break the neckline, it took the my few days absence to climb higher. What resulted is a double bottom which measures a minimum objective of 3,320. The indicators are at the top with no diviation of reversing yet. It is probable that STI would reach this level.

It is also interesting to note that the move now seems to take the 5th wave of the direction. So am I seeing an extended 5th?

Labels:

12/21/2010

I am feeling like holiday now

I was on leave from Friday till Monday and I went back to work today. While I need to work, my drive is very low, primarily because I am going on leave again by this Thursday. Yes, I am still clearing my leaves.

One may ask why not take the whole week off to have it cleared in one go? the problem is this, taking a lone absence from work also implicates that there is very little work for you and therefore you might be of less value to the company. So even when you need to take your leave, strategise, especially when year end is round the corner.


Fig 1 STI Weekly Chart

As I look at STI weekly chart, I also kind of thinking that it too want to take leave. So far it has continued its down trend. This some how tells me it is going for a 5th wave? RSI and Stochastic is still coming down, so I guess it will be continuation? At present it is supported by the 21 weeks moving average at 3,108.


Fig 2 STI Daily Chart

The head and shoulder pattern is more obvious on the daily chart with right shoulder mirroring the left. At the same time, we also see STI is presently support by its neckline at 3,122. It is also interesting to note that unlike the weekly chart, both indicators are at the bottom but without divergence. So is there a rebound before heading south again?

My take is: If it breaks 3,122, it is heading south. If it gap down tomorrow with open below 3,122 and stay down, the down trend is even more firm, even if it will not match the minimum objective.

Labels:

12/16/2010

The completion of right shoulder?

I did not up-date my blog last night, partly because I felt I needed a rest, partly because I felt that it the market would not go far. When I read the charts on Tuesday night, nothing really interested me at all.

These 2 days, I am pretty hooked on "to Catch a Predator" and even googled on the program. I was surprise that it started its first program by 2004 and last episod (so far) was 2007 due to shroud of controversies and attacked by competitor networks.

Nevertheless, I feel that its a good program for deterance and awareness of sex predators online. So even if the producer's aim was the rating, something good came out of it.

I am actually quite surprise that after airing for more than 4 episods, potential sex predators should be vary and think twice before trying their luck on 13 year olds potential prey. They have done a total of 7-8 episods and still people willing to walk into the house without much thoughs. The most memorable to me is not the naked men ( there were 2 ), but the man who brought his 5-year old to look for the "teenager" for sex. What was he thinking?! Educate his son that its okay to have sex with a minor? I seriously doubt that his son would be safe from him at all.


Fig 1 STI Daily Chart

Well, if I said nothing much happened, it would not be very true. STI has broken the envelop, in this case the neck line of a double top (small one) and went south. It tried to climb back up today with opening higher but fell back to yesterday's low.

If it goes all the way of the double top, it would be hitting the minimum objective of 3,118. This is quite coincidental to the present support level of the head and shoulder's neckline and 89 days moving average of 3,119. So I guess 3,119 it is.

While I am pessimistic about the pattern I see, the indicators are at the bottom at the moment and I guess temperorily the down side might be limited. The indicators might need to produce a divergence first before the chart turns.

Labels:

12/13/2010

I am getting old....

I went on a business trip last week to Bangkok, Thailand.The first thing that I asked myself was "where is my plane?" It was supposed to be an 8:25AM flight and yet I could not find the flight number at that time slot. It took me some time to locate my flight number which was retimed to 11:00AM. A check with the counter revealed that the flight was in late the night before and the crew have a mandatory 8 hours rest before they would fly again.

So what to do? I was there at 6:15AM, check-in with a complimentary breakfast coupon, have my breakfast at Burger King. I actually prefer Burger King's breakfast than Mc Donalds', its probably because my family has been having Mc Donald's breakfast more frequent than BK in the past.

Well, the next thing I did was to work at the airport, started with sending firy E-mails to my people to get them to work.

I reached Bangkok by 12:30PM (Bangkok's time), what greeted me at the office there gave me a scare. There was no body in the office! Turned out their boss brought them out for lunch and was only back by 2:00PM. I gave a short course to the technical people and visited one customer, ended my day at 7:00PM.

"That wasn't bad, I still can handle customer visits after all these years." or so I thought. By the third day, I screened through 6 customers, at least an hour each, repeating the same presentation and demonstration, making attempts to convince them to use our solution (with success). By the last time I finished with the last customer, I practically forgotten whose wanted what. I was in total exhaustion.

I could not recovered even after a night's sleep after my return. Every night I slept at 10:00-11:00PM and woke up around 7:00AM throughout the week end and I have not even fully regain my energy.

It was not used to be like this in the past. I think I am getting old.


Fig 1 STI Weekly Chart

I wanted to do an update on STI last night but the service provider seemed to have gone off line. Well, what can you expect from the the Malaysian Malays?

As I looked through the weekly chart of STI, nothing has changed so far. It seems to be doing the second wave and might have even completed right now. Both Stochastic and RSI are heading south. The difference between the 2 is that Stochastic is closing in at the bottom while RSI is still half way there. So am I right to assume Stochastic might be hovering at the bottom for a while waiting for RSI?

On weekly basis, it is supported by the 21 days moving average at3,108 and resisted by the trendline at 3,201. Now this is the interesting part. This is the second time the counter fall below the trend line, I would be alarm if I am in the market right now.


Fig 2 STI Daily Chart

On daily basis, things are slightly different but my feel that they are not far off. Stochastic is at the top but turning while RSI is on its way down. So is the correction over yet?

At times, the piece looks a little like a B formation and might be finishing a rectangle, either that, it is forming a double top. It is trapped between 3,219 and 3,168, so crossing either of these 2 levels are quite significant.

Why is it more a 3-wave than a 5-wave pattern at this time? This is because the low on 7th Dec penetrated below the high of 29th Nov. It violates the requirement for a 5-wave pattern.

Another worrying thing is STI has crossed below the trenline last Friday and remained below even today. Now I am not very sure what the probability is for this to break down, I would at the moment considering a higher chance of down trend than up.

On daily basis, it is supported by the 89 days moving average at 3,117 while resisted by 21 days moving average at 3,187. The trend resisting the counter at 3,197.

Labels:

12/06/2010

Its been a hard day's night....

I was on leave since Friday afternoon. The purpose is to clear outstanding leaves and only 7 days are allowed to be brought over. It was supposed to be a full day's leave but I cancelled half a day because of a meeting with customer in the morning. Anyway, it was quite stupid of me to cancel 1/2 day, I have have cancelled teh whole day!

To start with, the meeting started 10:30AM and it lasted till after 12:30PM, I have lunched with my colleague and by the time I sent him back to office, it was already 2:30PM! By the time I reached home, it was 3:00PM. I just wasted 1/2 of my 1/2 day leave! Life was not that great after that, my wife asked me to do some repair to the house and I used up the remaining 2 hours to fix the wall and the bathroom cracks!

I am on leave today, but only less than half a day belong to me. I went for my Taichi in the moring after breakfast with my wife, then it was home for a short shower and rest. Right after that it was to the office to collect something I have missed and followed by fetching my kids. I have promised them a holiday after 12:00PM today and I have to be a man of my words. My parents weren't really like that and I have collected a lot of broken promises as a result, I don't want my kids to feel the same way.

Anyway, we have chicken rice for lunch, then off to Parkway Parade,where they enjoyed the arcades, eat yogurt, check up book stores and get one Play Mobil each on my tap. They are sleeping now so I guess this is the only time frame I have for my last entry before heading to Thailand.


Fig 1 STI Daily Chart

The chart was only up-dated till Friday last week, when I saw the chart, I was quite surprise of the free fall on Friday. It probably penetrated the high in the morning and plunged to the bottom by the end of the day.

At its peak, it failed to poke through successfully on the 50% Fibonacci retracement resistance. While Stochastic is still climbing higher, the RSI on the other hand is not. It is again a little difficult to make the call right now. My feel right now is that there is still a little to go for the correction (upward). The 21 Days moving Average is resisting at 3,184 while the 50% Fibonacci Retracement resistance at 3,218.


Fig 2 STI Weekly Chart

Looking at a higher time frame I see a slightly different picture. The Stochastic and RSI is totally in reverse of the daily chart. Stochastic is still on its way down while RSI reversed. But because it reversed on half way mark, it probably shows a correction instead of a reversal on STI.

The trend resistance/support for today is 3,178 while the 38.2% Fibonacci retracement resistance at 3,196. The last up-date I have is STI hovering around this region (3,198).

P.S. A look at STI chart on Today's paper give me the feeling that it is doing a counterwave. If this is the case, probably a is completed and it is doing b. From the looks of it, it could be wave 2 of A, if this is true, STI would be in deep shit.

Labels: