Google
 
Web thoughts-denzuko1.blogspot.com

My Charting Blog

It is interesting that I start off this Blog when the Singapore Stock Market is heading south. However, this makes it more interesting for me to write on as the market turned volatile. My interest is Technical Analysis, TA for short. I love to look at charts and predicting where they are heading. This blog is or me to record my thoughts on the market. The articles on this blog are based solely on my personal opinion on the charts that I read and readers should not take it as absolute.

2/26/2023

Dow Jones, Nikkei and Hang Seng Up-date - 26th Feb 2023

It has been quite a while since my last up-date on these 3 counters, DJIA, HSI and Nikkei. My last up-date was in Nikkei, Hang Seng and Dow Jones update -- 29th Jan 2023.

I was at that time bullish on HSI, bearish on DJIA and expected that there was some more up-side with Nikkei due to its short-term trend line.

Since then, I had some hard time for the next update as the signals were kind of in conflict with each other, I have to sit on the sideline and wait for them to develop. 

What is happening now to these counters? 

Let's start with Dow Jones.


Fig 1. Dow Jones weekly chart

Dow Jones shows a more definite decline this week, with a long bar crossing and stayed below the 55-week moving average. Will it come with a 100% reversal in the coming week? I don't know, and I have to base my analysis from the signal given by the chart pattern.

 For the moment, I suspect that Dow Jones at least has a little more downside, with short term support at between 32,284 to 33,070, of which the upper level is crossed. It will be testing the 89-week moving average support presently at 32,702.

Should these levels fail, the tendency of further drop will be high, and we shall see further support between 26,420 to 29,587.

Assuming that the present level of support hold, I estimate a high chance of Dow heading higher to level of 40,240 to 47,399. That will be spectacular, isn't it? However, for that to happen, Dow will first have to cross its previous high of 36,952.


Fig 2. Nikkei weekly chart

To be frank, I am still uncertain on Nikkei, looking at my work on the chart, it is not difficult to tell me that there is no uncertainty when all the readings with reading heading downward. there is even a descending triangle formation trying to convince me that "yes, I AM going down."

So what is troubling me?

For the last 3 weeks, while showing some weaknesses with some congestion, it maintains afloat above the moving averages, I am still uncertain about Nikkei as a result. 

Only when it breaks the moving averages that give me more certainty of its trend. For the time being, I can only consider Nikkei to remain in congestion. 


Fig 3. Hang Seng weekly chart

The momentum of its ascension was strong, so much so that it made me question my earlier judgement on this counter.

Nevertheless, it seems to have failed to break through the moving averages, reversed downward and coming down with momentum almost equal to that if its ascension. Its descent today is decisive with closing below the 21-week moving average.

There is a possibility of pull back upward in the coming week due to the strength of its downward move. Unless the Hong Kong government come up with some intelligent policies to support its economy, I doubt that it is able to reverse back up at this moment.

Where might be its support then?

I see support between 14,848 to 17,847 using projection, while its closest retracement support of 19,576 (38.2%)  and 17,636 (61.8%).


Labels: , , , ,

2/21/2023

One refuse to go down, one refuse to go up...

I mentioned in my entry last week that I will be up-dating the HSI, DJIA and Nikkei. IT did not happen. However, it is not because I am lazy, I am simply uncertain about the conflicting signals on the 3 charts. 

When I looked at the currency charts, apparently USD seems to have reversed upward, strengthening against all other currencies. I will need an additional week to confirm this.

As a result, I could not figure out what to up-date.

Glancing through my portfolio of interest, I came across 2 charts, STI and KLSE (KLCI). These 2 seems to be going in the opposite direction, one refuse to go up, while the other refuse to go down.


Fig 1. STI weekly chart 

The lock down stopped the descend of STI in 2020 and its recovery continued till 2022. While seemingly reversing down, it did not reach the intended objective and reversed back up due to support from the Bollinger band envelop.

It congested momentarily after breaking through the moving averages made further headway before coming back to retest the 8- and 21-week moving average. I suspect this is due to the resistance at 78.6% retracement line, the same resistance stopping the up-thrust of STI in 2022.

Nevertheless, the moving averages are all climbing upward, supporting the continuation of STI up-ward. STI is in fact very close to its previous high in 2022.


Fig 2. KLCI weekly chart

The recovery of KLCI since 2020 is much weaker and the momentum depleted even before 2021. It retested the trendline and retreated in 2022. It is presently getting close to the same trendline again.

While there is a projection measurement indicating a huge advance up-ward, at the same time, a more minor projection indicates continuation downward.

I feel that while there is indication of up-trend, there might still be more down trend before its reversal. Partly because the moving averages are in alignment of down trend.

Labels: , ,

2/12/2023

Checking on FTSE and DAX - 12th Dec 2023

I was going through the charts at the end of the week, and I was not very keen on having any entries on them. First off, The counters are in congestions, and I am having some trouble figuring out their trend. Furthermore, the only one with clearer indication is Nikkei. Nevertheless, I have decided to up-date these counters in the coming week.

I then thought to myself, is there any counter that I have not touched for a long time? Going through my entries, seems like it has been quite a while since I last checked on FTSE and DAX. My last up-date on FTSE was Is Britain's economy in trouble? dated Oct 2022. DAX was seven longer in my entry DAX and FTSC dated entry in April 2022.

So FTSE and DAX it is for this week!

Fig 1. FTSE weekly chart
FTSE was on a gradual climb after its collapse in 2020 and I came to believe that it should be reversing downward in my earlier entry.

Apparently, FTSE is not ready to do so and shot upward with support of its Bollinger band. The alignment of moving averages seems to support the continuation. The earlier congestion happened after FTSE reaching its first resistance zone between 6,521 to 7,138. 

It is now testing the previous high with its closing still remains below the last high mark of 7,903. There is a possibility of pull back before new height can be achieved.

The congestion created an additional pattern suitable for projection measurement, leading to next resistance level of between 8,043 to 8,869.

After it began to climb, its formation leads to a minor read with resistance between 7,855 to 8,196. 

FTSE has actually crossed level of 7,855 with minor congestion before its next climb. This gives addition new resistance level of 8,060 to 8,278.

While being able to derive many resistances, I noted that there is no alignment between them, giving me the impression that these levels may not be strong enough to stop its climb.

Of all the resistance levels, 8,043 and 8,060 are very close and it is a possibility that there could be a reversal at this point. 

Fig 2. DAX weekly chart

DAX is was stronger than FTSE, achieving new peak of 16,290 in November 2021 after the plunge in 2020. This was followed by a retracement of 50% to a low of 12,414 before resuming its climb.

At present, it has broken through a series of moving averages, retested these resistances turned support level. before continuation upward. The most pressing issue for DAX now is to break through its peak of 16,290. At present moment, it seems that DAX has the momentum to do so.

Utilizing its major move, the projection indicates resistances between 16,824 to 19,892. At the same time, it's uptrend behavior also provide indication of more minor resistance level of between 15,529 to 16,604. Lastly, it is latest climb, the resistance between 15,819 to 16,384.


Labels: ,

2/09/2023

A Bitcoin up-date: Is it reversing?

It was some time ago when I did an entry on Bitcoin titled What is happening to Bitcoin? in August 2022. A lot happened in the crypto arena magnified by the FTX scandal. 

At one point, I wanted to come out wiht a piece of article on crypto as I see it as a con job, the article turned out to spread so wide especially evidence of scandals are so wide spread including FTX, One Coin and the sketchy origin of Bitcoin itself. 

So much so that I gave up working on the article.

Stock for instance, gives you a portion to the company; indices derive from the stock price of a basket of companies listed in the stock market; forex is an exchange of currencies; commodities from the trade of materials.

But what backs the crypto? Nothing. In fact, the FTX scandal demonstrates that you can create a crypto for trade out of nothing. It is upto the creator to decide what price he wants to give.

It is also interesting that the crypto world was once viewed as the next BIG thing to replace existing currencies controlled by the world governments. Even the trading platform I use once with ability to trade crypto currencies, the group has since been removed.  

Fig 1. BTC-USD weekly chart

Since my last up-date, Bitcoin went on to a new low. At the same time, its descent does not come with the momentum to push it forward and gradient of descent is gradual.

During more recent weeks, it started climbing upward, only to congest again during the last 2 weeks.

The downside readings remain unchanged, with a double top formation having support between 6,664 to -7,075. Using zig zag pattern on the downtrend, the projection provides support at between 12,481 to 26,082, the later level which coincide with the present level of the Bollinger band envelop with the higher-level moving averages (55-, 89, and 144-week moving averages) nearby. this seems to be the possible resistance to stop Bitcoin at the neckline at 28,893, like what I have mentioned in my earlier entry (one of the possibilities).

Furthermore, with the steepness of the descent in 2022, it is also possible that Bitcoin to congest in a narrow band for a longer period of time, before it's further decline.


Labels: ,

2/06/2023

MYR is actually doing well!

After I did my few entries on the currencies in Why oil price went up? and Is USD on free fall?, I wondered,"what about Malaysia?"

In my last up-date on Malaysia in How is the market judgement on PRU15 of Malaysia during December 2022,  I have noted a little up-side while a higher potential for further slide in KLSE. At the same time, I have found it interesting that MYR was in fact strengthening against the USD, of course with a possibility of correction before further downward movement (meaning MYR strengthening against USD).

KLSE did climb further but with the multiple level of moving averages resisting on its path, the upthrust is weak. 

What about the MYR then?

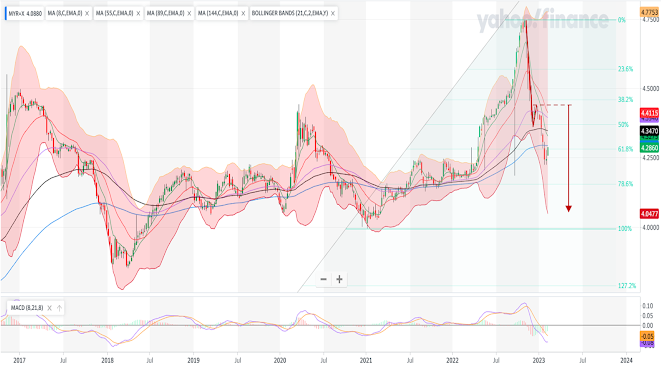
Fig 1. MYR weekly chart

USD actually failed to further correct and continued on the downslide against MYR. It has broken through the 144-week moving average and presently testing the moving average support turned resistance, coincidentally the 61.8% retracement line.

Nevertheless, the mild congestion earlier allows me to use projection to determine the possible supports, which is between 4.0525 to 4.2003. There is one retracement support within this range at 4.1514.

What happen when MYR compares with SGD?

Fig 2. SGDMYR weekly chart

It was really a long time ago when I mentioned SGDMYR in December 2022. It went up, peaked and reversed downward. It paused and presently breaking new low, only to be supported by the 55-week moving average this week.

While having new lows, the body indicates divergence as the body of latest 2 bars are green. Considering the counter is floating right above the 55-week moving average, it is possible for SGDMYR to bounce upward from here.

At the same time, the earlier correction does indicate some more downslides. I see the support levels at between 3.1199 to 3.19397.  The target coincides with the 61.8% retracement line at 3.1138. 

Labels: ,

2/04/2023

Is USD on free fall?

After my last entry Why oil price went up?, I noted USD weakening against SGD, it made me wonder how it is performing against other currencies.

Fig 1. JPY weekly chart

How shall I say this?

Compare to JPY, USD seems to be on a free fall. This is a spike reversal although the the peak bar did not exhibit a single bar (or shooting star candlestick) or 2-bar reversal.

While it fell through 55-week moving average in January 2023 and remained below till now, it nevertheless seems to be losing momentum.

I feel that it is possible that a correction might be in range. However, its 8-week moving average is in process of crossing the 55-week's, we might need to wait a little longer, probably until the 21-week reaching 55-week moving average.

I do not really have any projection read for the time being. So based on the retracement measurement, support level is at about 120.76 to 126.96.


Fig 2. EUR weekly chart

Similar to JPY, USD is also on an apparent free fall against EUR. However, there are more pauses for EUR, making it looks like EUR is with a 5-wave down.

The 8-week moving average has already crossed 55-week's and it is about to reach 89-week's. EUR even crossed the 144-week moving average this week and closed below it. It will be interesting to see if 144-week moving average can continue to resist the counter from going back up.

Using projection, the next support levels are between 0.8584 to 0.8948. At the same time, EUR is about to reach its 61.8% retracement support at 0.9005.


Fig 3. GBP weekly chart

Just looking at the chart, do I need to say more about GBP?

Yes, there is something to say. GBP seems to be the weakest of the 3 currencies. While the other 2 breaking the 55-week moving average, GBP was actually first supported by its 55-week moving average before breaking through the second time. 

In fact, the moving averages support for GBP is stronger than that of EUR. As such, can I say that Europe's economy is presently stronger than UK and that the UK market is less attractive to the investers?

Using projection measurement, I can see support at between 0.7522 to 0.7874, coincidentally its 144-week moving average position at the moment.

GBP is again congestion after crossing the 55-week moving average. Making a potential set up for another projection measurement. However, the set-up is incomplete, so I won't be doing the measurement for this just yet.

In my last up-date on USD in Federal reserve considering slowing down of rate rise...., I have estimated USD would continue to weaken against other currencies. Looking back that entry, the few counters here is either near or have reached the objectives set. 

I am not boasting about my skill set here as there is little skill set needed to set up measurement based on Fibonacci retracement and projection. I am concerned. 

USD is actually on some kind of free fall after reaching its peak. If I am to use a metaphore on this, I can only bring in the Super Nova, the final burst of a dying star. It is possible that people are dumping USD! Considering the recklessness of the US politicians taking for granted the world dependency on its currency. I believe that they have not even noticed potential danger ahead of them. 

That this point of time, they are still thinking of rising the debt ceiling and taking the easy way out instead of cutting spending. What will happen should USD reach the next level or even lower?

Devaluation of USD can lead to inflation or even hyper-inflation. By then USA will be heading for hardship, worst still, it is bring the world along.


Labels: , ,

2/02/2023

Why oil price went up?

I was cfilling up the tank of my car the other day and noticed that the oil price went up from SGD2.70 to SGD2.75, I wondered," what the hack?

My last up-date on oil price was quite far away, in Crude oil reversing up...with power..... dated 22nd Oct 2022, I saw the possibility of Crude oil rising back up. It did not happen and I chose to leave it aside.

Since then, Crude oil continued to slide downward, slowly. Which was the reason for my surprise. Has it climbed up from its fall?

Fig 1. Crude Oil weekly chart

At the time of writing this article, Crude Oil fell below the moving averages, went into congestion and lately resisted by the 89-week moving average.

At this point of time, it retreated from 89-week moving average and testing its 144-week moving average. 

I will have to change my view on Crude Oil, that the chance of it heading further south is much higher.

Based on its top formation (double top), its next support level should be between 56 to 70. Using the more immediate set up on the other hand, the projection support lies between 59 to 67. 

These 2 sets of values lie close to each other. I suspect the support will be quite prudent.

 If oil price is on the down slide, what else can cause the increase in oil price locally? Would it be due to SGD depreciate against USD?


Fig 2. SGD weekly chart

SGD is actually on a rapid rise against USD. IT broke the low of the past wave and stayed below the mark.

Looking that the chart, I can use expansion to measure a much farther support line, which lies some where around 1.222. At its worst of 100% expansion, it will be 1.167 per USD.  

Its zig zag pattern on the other hand, measures a support of 1.3003. If this support is broken, then 1.2599 will be the next support level.

Seriously speak, if it comes to SGD1.167 per USD, it is not the matter if we should prepare for tour to US, but the stability of the financial market, both US and the world. US is the world's largest debt holder, through issuance of bonds bought by other countries. The shrinking of USD will lead to a shrinkage of the wealth of these countries as well.

To me it is quite scary.

As for the oil price in my neighborhood?   I am not sure. May be the oil company here is a trend follower? Let's hope that the oil price continues to go down next week.


Labels: ,