Google
 
Web thoughts-denzuko1.blogspot.com

My Charting Blog

It is interesting that I start off this Blog when the Singapore Stock Market is heading south. However, this makes it more interesting for me to write on as the market turned volatile. My interest is Technical Analysis, TA for short. I love to look at charts and predicting where they are heading. This blog is or me to record my thoughts on the market. The articles on this blog are based solely on my personal opinion on the charts that I read and readers should not take it as absolute.

5/28/2023

Hang Seng continuation

I am feeling lazy. I was having this question if I should do my entry during this weekend.

I am not sure why, probably because I am lazy, or I am getting old and losing my energy?

The news on youtube.com mainly deal with companies going woke in support for transgender propaganda, and conservatives are calling for boycott, especially when certain corporates like Target revealed to support organizations supporting non-adult transition to the extend that they demand schools to "help" the students to hide their conversion from their parents.

Transitioning is a life changing process because it is irreversible, you can't reverse back to your original gender should you find that it is not what you think.

Anyway, let's move away from the west for the time being, head on to the east today.


Fig 1. Hang Seng weekly chart

I have various entries on Hang Seng, I am not positive about Hang Seng in the long run based on that BIG top it has created and behavior of the Hong Kong government more interested in pandering to their master than serving the people.

I have a relative going to Hong Kong recently and she feedback on her return that Hong Kong is no longer like what it was before 2019. There is a lack of life compare to its past.

In my last update in Dow Jones, Nikkei and Hang Seng up-date 23rd April 2023, I indicated some mix read on Hang Seng, I suspected further down slide with support between 17,061 to 18,512.

Hang Seng closed the week at 18,512, the 61.8% projection support.

The week's move was decisive with a long bar and MACD sinks into negative. Will the coming week rebound from the support? 

I suspect it will retest this support before sliding further. The next support will be 16,104 to 17,061.


Labels:

5/20/2023

Nikkei run away surge

I have been writing this blog for years and in its early days, I have relatively high number of readers. Since I stop ped my entries some time ago, naturally the readership dropped to zero. 

As I restart my blog recently (like last year), there is an average 8 readers checking on articles. I am all right with this as my intention is simply to key in my thoughts and track my practice technical charting. 

Other than the 3 main indices of my interest and some key forex pairings, I occasionally check on counters falling into the limelight. My entries are some time here and there.

So it is to my surprise today that there is a whopping 150 viewers checking on my blog yesterday. I have no idea who they are, probably only knowing that it is from USA. I have no idea on which article that they are looking into. 

The only thing I suspect that people are checking on is Anheuser-Busch which was downgraded and on the way down.

Anyway, I believe this is a once in a blue moon incident on my blog. After all, the time of blogging is on a sunset streak.

As for today, I will limit my update to only Nikkei 225 and not on all 3 indices, the other 2  counters have still not much indication of breakout.


Fig 1Nikkei weekly chartIt has now reached 

It is interesting to note of a breakout on Nikkei 225. It touched a high of 30,980, 173 above the previous high of 30,807.

At the same time, it also crossed the 100% projection of a shorter-term projection at 30,345. The next level of resistance is the 127% projection mark of 31,645. 

To be honest, I do not find the break out from the previous high decisive, because Nikkei closed the week with 30,835, a mere 25 points above the resistance turned support mark, coincidentally below the Bollinger envelop of 30,851. 

I suspect the coming week will have Nikkei going to test the 127% projection level. At the same time, crossing 100% projection is with tendency of entering potential congestion stage before moving further. 

Another thing with the recent move of Nikkei. I am seeing multiples of 3-wave patterns giving me a feeling of counter wave moves. Can this be the c wave of the B wave? 

There are also another 2 points to note.

First, Nikkei also broke out of a double bottom and we can estimate a potential objective of between 32,157 (61.8% extension) to 33,985 (100% extension). However, it will also mean that we might be seeing a correction soon. Probably the resistance at 127% projection will ask Nikkei to retest the neckline of 29,231.

Now, this part is on a larger move, The counter began to congest after a surge ended in 2021. This congestion formed a potential projection target of between 33,360 to 39,216. 

If this is true, then Japan economy will be having a very good future.


Labels: ,

5/13/2023

The distructive power of Narcissism

'Narcissist' is a term commonly used by people nowadays, especially in US of A when women describe men whom they broke up with.

But what exactly is Narcissism? It means self love. In psychological term, it is a defense mechanism to protect what is left of a person self-worth. for Narcissistic tendency to exist, the person must have very little self-esteem within.  

How do we know if a person is narcissist? One simple trait of a narcissist is that he or she cannot be wrong. It is everyone else who are wrong. Being wrong only means 

This seems to be what the CEO of Anheuser-Busch is doing. 

I did an entry on Anheuser-Busch in The psychological problem of the US of A. At the time, many were trying to use the drop in the Stock price to justify the losses. I was skeptical at the time as the chart has shown traders uncertainty and pause to see the company's action before deciding their next step.

While true enough the coming 2 weeks shown moderate climb in the stock, the market was still undecided as insufficient action from the company. It seems that the last thing that the management team want to do is being accountable. 

Throughout this period, they pointed fingers onto everyone else, from removal of the marketing VP, external promotion agency, and customer misinformation. 

The CEO also released an open letter, which seemingly only mention how great he is serving the country, how great a burden the company is in representing America and how many people are involved in the organization. 

The company also released an advertisement with a horse galloping through America, telling people Bud Light is America.

What Anheuser-Busch did was only to demonstrate the level of grandiosity of the organization, how American they are and seemingly labelled the boycott as a threat to the American way.

Unfortunately, Anheuser-Busch IS NOT American, it belong to Belgium in disguise as an American entity. This explains its overcompensation to be American, just like Trans-women are more women than women to the extent that they are so unnatural. 

The simple fact here is that the promotion scheme successfully associated the brand to transpeople, indicating that if you drink Bud Light, you are trans, and with 80% of its customer base being male, it is sure to move the male demography away from the product.  

There is no accountability in the management team. The CEO does everything except for accepting responsibility.

Sales fell through the roof, and like I have said in my earlier entry, this will be the one thing that will really threaten the parties of interest. Just this week, HSBC downgraded Anheuser-Busch to hold.

So what is going to happen next?


Fig 1. Anheuser-Busch weekly chart

While the integrity of the chart remain intact so far, the major trends remains unchanged.

The recent mild congestion of the chart leading to the formation of a flag. The HSBC down grade actually caused the counter to fulfill the 100% objective of the flag. It is barely supported by its 21-week moving average.

If this trend continues, the next support will be the 55 and 89-week moving averages, with value of  59.06 and 59.45 respectively. However, it is important that the counter should not cross the previous low of 57.79, coincidentally the 38.2% retracement. Breaking this support level may indicate a further drop to the 50% retracement line and the bollinger envelop of 56.

Labels:

5/06/2023

EUR GBP comparison

 I was going through my earlier entries and noted some issue on GBPUSD chart in Currencies April 2023 update. The chart did not seem right and I was wondering if it is of a different time frame.

It also led me to consider that I should do a comparison on the 2 currencies, afterall they are to me a couple who have just gone through divorce. It also brought up the thought as to who is the husband and who is the wife in this separation. 

Based on recent statistics, the woman is the one who initiate the divorce as she is the one who is normally unhappy with the situation at hand, and most of the time she would have found a new man to attached to for security purpose.

So in this case, I can justify that UK is the woman, UK was not happy with the restriction brought forth by the union and partnered up with its old flame, US of A before the divorce commenced.

Anyway, side talk over. Let's see how both currencies are doing as individuals and when compared to each other.


Fig 1. EURUSD, GBPUSD & EURGBP weekly chart

To begin with, both counters made a strong re-bounce on week of 25th Sept 2022, only to be stopped by their moving averages. 

EUR to me is stronger than GBP, since it penetrated through 55-week moving average and only to be stopped by the next level of 89-week. 

GBP on the other hand was stopped by 55-week moving average, twice before it could move higher.

Lately both encountered the highest moving average that I placed, 144-week moving average. While GBP stopped below 144-week moving average, EUR managed to rest above.

GBP seems weaker than EUR in all sense.

For the time being, resistance I see for EUR are as follows: retracement lines between 1.1280 to 1.1757 and a projection target of 1.14373 to 1.200705.

GBP on the other faces resistance at 1.2761 to 1.3429, while a projection target of between 1.3088 to 1.3806.

If this direction is consistent however, there is another currency in trouble, USD. Because USD is weakening against both currencies.

To further confirm the hypothesis that EUR will fare better than GBP, let's analyze EURGBP. 

There seems to be a huge reversal on 25th sept 2022, making it plausible that GBP is improving against EUR. The counter seems to be in a congestion phase after support at the moving averages. While it seemingly climbing back up, it gives me a feeling of lacking in momentum. 

The counter also seem to be in a sub-wave congestion downward, meaning a potential up-trend after then. But because its present trend has yet to complete, I refrain from estimating its up-ward potential until a more certain indication.

So for the time being, the trend is down, with projection support at 0.8713, which EURGBP is right above. A further support level of 0.8512 should this be broken. 

One thing to note here is the 55-week moving average, which lies right below the 61.8% retracement as well as projection, giving quite a good support for this pair. There is a possibility of reversal, but I have to wait and see before concluding.

Labels: , ,

5/01/2023

Tucker and Fox

 It is first of May today, what does it mean?

Public holiday! It is also rare that this public holiday is shared by the whole world, very like the lock down of Covid-19 (Wuhan virus pandemic).

Most of us understand this is known as labour day, except for United Kingdom (UK) and probably any country with a political party with name Labour on it. While I was studying in UK, I got to know that it was called May Day.

While we all believe that it is a celebration and appreciation of the working people, it is little known fact that Labour Day is actually a Socialist Movement,  One interesting fact is that the first Labor Day was declare to be on first week of September  in 1894, in the US of A and not Europe! 

A Haymarket Riot happened between labour group against the authority in Chicago started first May 1886 and lasted for days. A bomb was set off on May fourth, killing 7 officers and 8 civilians.

The event inspired the socialists years later in Paris who declared May Day a holiday to honor the workers' rights.

workers went on protest again in May 1894 against the 16-hour work days with low pay at Pullman Palace Car Company. the protest was joined by the American Railway Union (ARU), resulted in crippling of country's rail traffic.

While the then president Grover Cleveland signed into law declaring Labor day as a national holiday, he sent troops to Chicago to end the boycott. the troops shot into the crowd killing dozens of people.

For more information on Labor day and May Day, you may check out The History of Labor Day (investopedia.com) which I got this information from.

As for today, it is a little early to revisit the indices and forex. I am feeling more like Fox.

It was on the news on Monday that Fox terminated its contract with Tucker Carlson, a conservative commentator with very high viewership. Much speculation as a result as to why the termination, including the conspiracy around Fox's settlement with Dominion. 

Naturally, the stock tumbled with news of Fox terminating its top rating show host, and some used its stock plunge to claim the amount of damages Fox incurred.

This got me interested in this counter. 

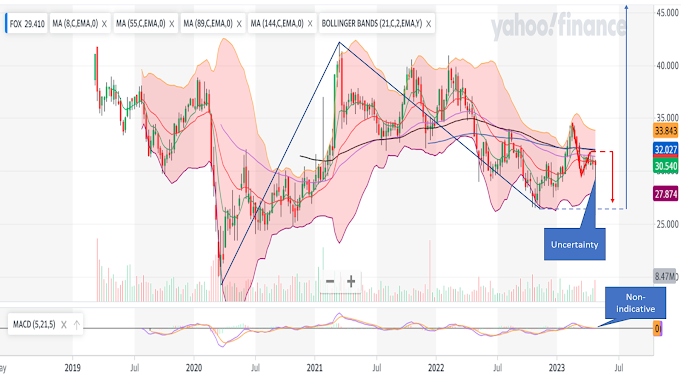
Fig 1. Fox Corp weekly chart

It is interesting at first glance that Fox is SO CHEAP compare Twiter and Facebook. Even Netflix price is much higher than Fox. It is quite obvious that market deem the importance of broadcasting is diminishing with the rise of small independent content creators.  

The pattern of the chart looks to me like in a counter down trend and poise to move upward, especially when recent peak in August 2022 superseded the previous high. It only retreated back below the moving averages and retesting the resistances in its recent moves. Nevertheless, it continued to be held down by the 55-week moving average and by the time Tucker was fired, it broke the low of March 2023.

Even though it tried to recover from its plunge, it failed to break upward and closed in red below both 8 and 21-week moving average.

From this chart, there are 2 reading that I am interested in: a major move and a minor one. he

In a major move, it has potential to head higher to between 40.57 to 49.36.

In a more minor move on the other hand, it may head lower to between 26.95 to 28.79.

One thing to point out here though, the week's bar is indicating market uncertainty, meaning that the market is unsure about the effect of the termination. My suspicion is due to it congestion behavior at the moving average. 

It may be good then to look at its lower time frame.

Fig 2. Fox Corp daily chart

Looking at its daily chart, fox is attempting to recover from its plunge. While there is a momentum upward, it is presently resisted by its higher moving averages. While there is a potential crossing from MACD, it has just gone below neutrality level. 

I suspect that it may test the higher moving averages in the coming week while the main trend remains to be downward.

I was working with my son on a study of the CN tower of Toronto and part of the content was to discussed the future of communication tower, which primarily is meant for broadcasting.

It seems that there are multiple threats to broadcasting business especially with the advancement of the internet and the Cambrian explosion of content creator. there will come a time when the content creators will meet an extinction phase, the move still spell bad to broadcasting services, which I believe is on a sunset stretch unless they re-invent themselves.


Labels: , , , ,