Google
 
Web thoughts-denzuko1.blogspot.com

My Charting Blog

It is interesting that I start off this Blog when the Singapore Stock Market is heading south. However, this makes it more interesting for me to write on as the market turned volatile. My interest is Technical Analysis, TA for short. I love to look at charts and predicting where they are heading. This blog is or me to record my thoughts on the market. The articles on this blog are based solely on my personal opinion on the charts that I read and readers should not take it as absolute.

5/30/2006

The amazing support and resistance level of STI

For the last two weeks, I was quite amazed withmy predictions, not that I am very good but how reliable is the resistance and support lines for STI index.

Earlier on I have set a few numbers for support and resistance, 2,398, 2,451 and 2,585. These are derived from past highs and lows on major moves, dated Mar 2000(for 2,585), Mar 2005 ( for 2,398) and Feb 2006 ( for 2,451 ). For the last few weeks, these three points have been the main concern for STI.

On the day when Mount Merapi erupted, it was the first plunge of STI, the index opened below 2,585, which became the resistance to STI's move. It then closed and congested at the level of 2,451 before moving further down, then continued to be supported by 2,398. Even for the plunge on 25th May 2006, the stock climbed back to above the support level of 2,398.

These three points therefore have proven themselves as an important level at least for the moves this round. Presently the stock continue to hover at the level of 2,451. Is STI going to penetrate upward this time round?

The latest chart displayed a gap before STI reaching the 2,451 resistance, it then followed by similar moves for 2 days. This in effect is forming a break away candle stick pattern, when tomorrow drop in with a long bar downward, the formation would be completed and highly likely that STI will travel further south.

STI is revealing more and more indications of its intention, this is especially so with the deminishing volume. Not only that it is an indicator, its continual reduction has in effect prevented STI from punching through 2,451, which is supposed to be a minor resistance.

Further to that, both 21 days and 89 days EMA IS above STI, continue to press it down. So STI has to travel south, which is the path of least resistance. I won't be surprise if STI is not supported at 2,398 this time round. If we also look at the chart in a classical way, the formation still maintain a flag pattern although STI did tried to penetrate through the formation once. upon completion, STI will hit the next support level at 2,355.

Careful threading at STI

I was dreading for STI to turn red today aas it would signify a evening star pointing southward for STI. It turned red and yet did not create the pattern to confirm on the Evening star, so there will still be hope tomorrow for an up trend.

Looking at the chart, the RSI is now higher with divergence, it still tells me that STI will be going further up ward. Similarly, the Stochasitc is also pointing up ward supporting the move. It seems like we really is having a more positive look for STI tomorrow.

The only problem that I have is still the volume that is forever getting smaller. This is not very good as it shows that STI's uptrend will be short lived.

The move of STI itself is stopped by the support turned resistance level of 2,451. If it is to go up, it will have to break this resistance level. The next level of resistance will be the 89 days moving average of 2,493. The support level for STI is presently set at its trend line of 2,407 and the support @ 2,398.

5/29/2006

Heng Xin

A friend on CNA forum asked me to take a look at this stock, Heng Xin. I agreed to check it up.


Well, unfortunately this is one of the set back of technical analysis. It needs back data to observe a pattern and is not useful for a newly IPO stock.

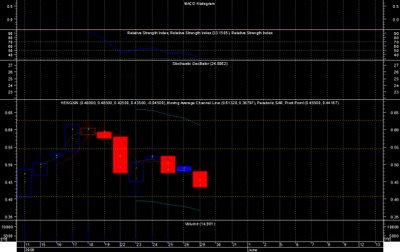
Anway, I took a look at the stock. Basically I only have RSI which tells me that it is still on its way down. There is still no indication that it may reverse yet. The candle stick has top off with a shooting star pointing down. Base on previous low, the support level at the moment is 0.450.

What I will be looking for on this stock is not on its up trend, but the stop loss level. If this stock falls below 0.405, then I will exit with a stop loss.

If on the other hand, the stock goes up. the resistance level is 0.545. But for tomorrow, my guess is that the stock will peak or supported at 0.45.

5/28/2006

Movement for Creative Technology

Creative seems to be one of the stock that many talk about. One of the reason could be that it is the first company to be listed on NASDAQ and that its minimum transaction is base on 50 units. In the latest closing, it is priced at SGD9.10.

One thing that I am interested in is exactly how much does Creative really cost in Singapore context. If I convert Creative into per 1,000 units transaction. The actual cost per share is in fact SGD0.455, a penny stock.

I have always been facinated with Creative share. To start with my first company Aztech was Creative's competitor. then Creative saved me during my darkest hour (refer to my Blog on" My romance with Technical Analysis" ). It is also one stock that is not easy to predict, since it is traded in both USA and Singapore. The trading from each sides are affected by the other.

Non the less, Creative have come down quite a fair bit from its top of SGD69.50. It is enough to make people wonder about its performance. Still base on the technical set up, I believe its move can be predicted.


Above is the weekly chart of Creative. If we consider Elliot wave on major moves, then it came down with a 5 wave movement and then enter a consolidation of B wave between end 2001 to early 2005 and then continued its descend. In fact its recent move has broken through the first support level (SGD9.90) with next level of support @7.60. Now if I actuallly use Elliot wave calculation with Fibonacci numbers, it should be going to -SGD11.085 for C completion. However, this number seems rediculous to me unless it is going bankrupt.

If Elliot is giving us a wierd value, we go back to basic pattern recognition. Between 2002 to 2005, I would consider a formation of rectangle. Base on the measurement, it is trending towards -SGD7.90, again a negative value. ( *sigh*how I wish that the B wave can end up higher.)

Could I have made any error while reading Creative? It is possible. Firstly the rectangle has been mroe than 3 years old. a bottom would normally take so long to form. Further more it is possible that Creative be supported in the area of 7.60, reversal upward will form a tripple bottom, granting it a move back to SGD52. So the make or break of Creative is crucial in its development between 7.60 to 9.90. However, this is still an assumption and can only be true if it breaks above 14.40.

Now stocks cannot go below 0, so disregard the earlier calculation and focus on more recent moves from 2005. If we have seen an A and B wave completion, then this should be the C. Calculation of C indicates a target of SGD4.56! Now if Creative breaks below 7.60, then this scenario will be quite true.

With 2 scenerio set in, next is to see if there is a higher possibility of up or down. Referring to the same shart again, the RSI is at the bottom and diverging up. When RSI touched this level in the past, the stock rebound. Further more, the Stochastic has also bottomed with prolong stay. It is therefore highly likely that Creative will rebound higher.

Both scenaio provides possibilities on where Creative is heading. There are still uncertainties. However, no technique in the world would provide 100% guaranttee, however, Technical analysis will allow higher probability of winning. As my master has said, " it is like looking at a flower blooming, the thrilling part is by letting it reveal itself to you slowly."

5/27/2006

My romance with Technical Analysis

I have learnt about the stock market since I was young. My father used to be very active in the stock market in hoping to earn more money for the family. It was unfortunate that his techniques were that of a lay man who bought on rumours. He ended up losing quite a bit to the market.

I have never actively participated in the stock market until I was 30. My first experience of the stock market however, dated back to 1994 when the company that I worked at that time got listed. I was offered 3 lots of the Aztech's share at around SGD0.89, I took it up. Not knowing what to do with it, I held on to it regardless rain or shine. I never sold the share when it peaked at SGD1.80 but eventually at a price of SGD0.40.

I have not gone into the stock market for 2 reasons. One, I have no money. Two, I did not know how to play as I have no idea how to predict the market. My opportunity of participation came after returning from my secondment in China, I earned quite a bit, and that entitled me to invest my money.

I was also a member of the biggest club in Singapore, the Social Development Unit (SDU). It organized activities for single university graduates. One of the activity that I participated was about the Singapore market. It was here that I met my master in Technical Analysis, Mr Leong Ying Yong. He was humourous in presentation with charismatic personality. His picture of Singapore's future was actually akopoliptical, in fact, I was depressed for 2 weeks after attending his seminar. Someone in the audience proposed to him to start a class on Technical Analysis. He took on the challenge, and I joined the class.

I fell in love with Technical Analysis almost immediately. It looked so simple to me and I managed to"master" the skill in a very short time frame. In fact I was one of the three most promising students of his. The trick with Techncial Analysis is the ability to recognise patterns, which happens to be my field of expertise. Being a comic reader, looking at pictures and figuring out what it mean is a second nature to me.

The three of us felt very invincible after the class. We discussed the technical set up of companies to see which one woudl be the best bet. All these while I continued to trade but without a single success, I never did wonder why it did not work for me then.

Eventually we chanced upon this stock Asia Food and Property (AFP). We determined that it would go up to USD0.35 (it was @0.22). I started to go in with 20 lots with intention to contra. The move did not realised and my time was almost up. So I intend to renew the stock with buy and sell 20 lots at the same time. Some how after one or 2 renewal, I stopped selling when I bought new shares. I eventually ended up holding 120 lot of this share.

Then came this faithful day when I went to Malaysia while still holding the whole lot. I remembered it very well because it was also the same day of market correction, the correction was similar to that of the recent one. AFP dropped to USD0.15! The effect of devastating and I was daze for days. The plunge not only wiped out all my earnings from the China secondment, it also put me in debt.

I told my broker who was also the wife of my master that I would not be able to pay her back on the losses. It was to my surprise that she instead asked me to enter 1 Lot Creative Technology. She told me then that there was virtually no seller in the market with the stock priced at SGD15. I also took up her advise of opening a trade loan account as well as credit account to get finance assistance.

Within 3 days of buying Creative, the share went up to SGD25. The earning did not actually cover all my losses but it at least reduced my debt to only SGD7,000, which I paid up. I still hold on to the credit account up till today although I seldom use it, it just act as a reminded of my SGD17,000 losses. It was a lot of money considering that I only have SGD12,000 in my bank account.

How has Technical Analysis failed me? Actually it was not Technical Analysis at all, it was me who was responsible. Technical Analysis is only a supporting tool to improve my accuracy in reading the market and stock. It does not in anyway guaranttee success and wealth.

What have I missed out that caused me to fail in my trade? It is obvious now that I have not been fully attentive in class. My master have more than once caution the class to " play with your system, not with the market". I did not understand what it meant then, but it is now strongly echoed in me.

I have to device my own system to trade and have the discipline to follow. This include not being affected by the market move, but only to listen to my system. Technical Analysis is an equipment being installed into my system, it makes up only part of the whole system which I use.

My master also told the class to play within our means. If we don't have the fund to play, don't play. It is important as it safeguard the long term survival. Over exposure will only means a quick death.

I held on to my secret for close to 9 years. Only in recent months that I have the guts to bring it up to my father. He was very understanding, but he told me," don't tell your mother about this." This is one thing that I make sure I follow.

The construction sector is still working in the Basement

A picture means a thousand words, and a chart tells a lot of future. This chart is the index for the construction sector. The construction sector peaked at 1,165 in mid 1999. It has since started digging lower and lower to reach bottom.

For a while, I thought that Construction has already met its low at 144 by 2003, but unfortunately it went on to form an upward wedge. Such formation very seldom break down. Therefore, Construction will continue to dig further down when it breaks down from the wedge. Presently the measuring target is 137. With the crossing of 21 day and 89 days EMA, it is waving goodbye to us. It may still want to climb back up, I believe it will be stopped by the 2 EMAs which presently at the region of 305 and 307.

Sun Shine Friday for STI or was it evening star?

I was frustrated yesterday when my service provider failed in up-dating my database. I knew that it was a crucial day for the STI and I can't afford to miss it. I ended up analysing the index and stocks from my secondary source. As if the tragic was not enough, my internet broke down and I was forced to stop half way. I have managed to look at one or two stocks and put in a buy order during midnight.

Anyway, STI today has done a spectacular move with a gap up from yesterday's close. Although not as impressive as the time it fell, it did well to let investors and traders see some light. My stock Wing Tai actually gapped up as a result and my order was not fulfilled. Its must be fate that this money is not for me to have.

While having such spectacular move, how exactly has STI performed and what has it installed for next week?


The chart read from RSI displayed a divergence indicating possibility of up trend from here. Stochastic has also reacted with a strong rebound. while STI gapped up. The two leading indicators does lead me to believe that we should see more positive move by Monday. What trouble me still is the volume that continues to deminish during this period. It still tells me that STI still has one more leg down. Further more, the candle stick pattern demonstrated a potential evening star, indicating a down trend, Monday's move therefore is very important. If it is indeed a down trend on Monday, it may be time to move out again.

Another worrying sign is the behaviour of the moving averages (MA) which was tending towards crossing down. If they (21 days and 89 days) crosses, then it would signifies a bear arrival. While STI still on the rise, the MA acts as resistance at 2,494 and 2,516. There is also a resistance level at 2,451 that may prevent STI's march.

`
The weekly chart shows me something else. So far Stochastic continues it south migration while RSI looks as if it is on the verge of a U turn. False break is observed on the trend line and support level of 2,404 and 2,398 respectively. Close watch is needed next week on this index, its volume has to be up when STI moves North, the reverse is a sign of crack growing bigger.

5/25/2006

Is STI going up or down?

It is some time not a good feeling to find that the stock or index did not go my way, or at least the way that I expected it to go. The performance of the index today is one of them.

I was wary with the way it behaved for the last 2 days. The diminishing volume was alarming as it indicated weakness in the index. However, I was quite confidence in the support level at 2,398. It managed to hold the fall once, I expected it to do the same this time round.

I was surprised to find STI fell through the support level with further penetration to 2,376. This would mean that it is heading for the next level @ 2,352, it did not, at the end of day, it retreated back to above the support level of 2,398. Further more, it kept itself back above the trend line support.

What we have just witness is a false break in the index, it is clear sign of weakness. The index may still go up this round, but it will definitely retest the trendline.

So will it be up or down tomorrow? It is unfortunate that my serive provider broke down today and I do not have the date for analysis. I have to resort to using my secondary source. It is not as comprehensive as my original data but will do for the time being. but without data, I have no chart to attach.

The index chart did no provide the volume for the index, but base on my memory, the volume is definitely lower today. It is a good sign as the volume is now not supporting a down trend, traders are holding on to their stocks.

RSI reversed downward but maintained higher than previous low. If tomorrow is an up-day, I should see it reversing, thereby giving the first sign of divergence, indicating STI moving up again. The Stochastic is more encouraging, it has in fact turned up and started climbing. This give me more confidence that tomorrow is up for STI. Support level still holds @ 2,398 although this round there is an additional trend line support @ 2,404.

My last concern at the moment is the confirmation of the hanging man formed yesterday. It still points to the south. Will the support levels be able to prevent the fall? I am presently betting that they will, but close monitoring is needed and if it crosses 2,398 again, it is time to run.

Troubled with support ( or the lack of it)

While reading the up-dates of STI, I can't help but to notice the weak volume support it has on its reversal. My master has ever mentioned to me that the movement of the stock or index is fire and volume is the wood, fire won't burn without wood.

Yet the STI today clearly shown reducing volume on up trend, making it difficult to climb further. While my wave count told me that the index has completed a 5 wave down, which mean A wave is completed, both Stochasitc and RSI are at the bottom having an up turn, both indicators have not yet shown clear signs of reversal. Worst of all a hanging man has been formed.

Does it mean that the reversal is short lived? It all depend of the move tomorrow. I have seen before that volume is late in catching up with the price and hanging man broke upwards. It may happen again. The final fate of STI lies in how it will performs tomorrow.

So far my read shows resistance at 2,451, support remain 2,398 and 2,350.While my stock reads has mixed result with many still need to be confirmed. I will have to wait till tomorrow.

5/23/2006

Has the STI correction completed?

It is a spectacular day today for stock market. After the close to world wide plunge yesterday, everyone is wary about how STI will perform today. I stood by the support level of 2,399, and miraculously STI stopped at 2,398.56 and rebounded. At the end of the day, it went back up to a level of 2,438. In total the fluctuation for the day was a total of 40 points. Although a far cry from the recent fall, but no less a wide coverage.

The question in everyone's mind is whether we have seen the last of the fall this round. I was optimistic at the end of the day, firstly it was supported at the level of 2,399, secondly, a strong rebound. Thirdly it seemed to have done a day reversal.

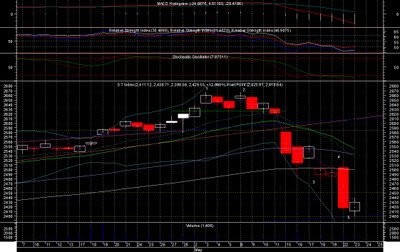
The chart above is the up-date for today. It is clear that today's move have not created any signal of reversal, both by candle stick nor classic reversal pattern. The volume has not supported the up-ward movement and all the moving averages are resistance to the index. Further more, all indicators are still down with no indication of divergence.

The only thing that make me feel that it has completed this round is the 5 wave movement with the low meeting the Fibonacci calculation @ 0.618 of wave 3 from 2,665 to 2,478. However, this 5 wave move does tell me that we are in a counter wave movement and we should be meeting the zig zag B wave.

So at the end of the day are we seeing an up-trend? I suspect so, although more is needed to confirm a reversal. How far is it going? If calculation is right, we should see the level of either 2,563. Meanwhile I would caution on the level of 2,499, 2,545 for the time being.

For those who are already in the market again, just be cautious.

5/22/2006

Is there improvement on Electronics sector?

In the recent Government report, it has indicated an improvement in the Electronics export. I am not sure what it means exactly. Does it mean that the Electronics industry is improving after years of down slide?

I have actually stopped looking at charts for a year due to the additional member of my family. I have recently managed to get myself re-organized and improved on my schedules, thereby allowing me to look at stocks again. The look on SES Electronics however, make my mouth opened.


The chart contains data of SES Electonics dated from August 2003 to May 2006. It peaked in January 2004 and has been going south since then. Considering the index as a reflection of the actual market six months ahead, Electronics has not been doing well all these while when other sectors were improving in their performance.

While I am still working in the Electronic industry, the pinch of the Electronic sector has not really affected my company. This is mainly due to the fact thaty my company's business deals mainly on reginal support. It has in fact did quite well in moving itself to regional market. As for local businesses, the focal point seems to be on only a few major players. There has been no new business so far. While I could still find abundance of customers into electronics design during the year 2000 to 2001, most of these customers seems to have folded their business or have their operations moved to China.

Singapore was teaming with distributors during its hay days, and the number has continued to grow. That is until the market was hit during the year 2001. As far as I know, many of my competitors have moved out to China looking for greener pasture. Companies like Achieva, Excelpoint seems to get a foot hold in China, Enzer repositioned itself to integrate higher to the level of consumer electronics, Flextech managed to get investment from Arrow. What's left are the major international players who have invested in Singapore and now struggling with thin margins or suffers low revenue.

Up till now, I am still waiting for the sun to rise again for Electronics. Will electronics regain its foot hold in Singapore? If yes, then in what form is it making a come back? So far the Government has opened up a few venues for Electronics in areas of wafer fabrication and LCD manufacturing. Unfortunately the take up rate for such offers has been low. In Pasir Ris where the government has allocated for LCD manufacturing facilities for instance, there are still a huge patch of land still vacant. Harddisk sector is left with Seagate, while Motorola is the only company in the mobile business in Singapore. The wafer fabrication facilities are mainly government linked. It is difficult to see at the moment how the Electronics is going to reverse its trend.

Going back to the chart, as its movement continue to go south, I can't help but to notice a wedge formation on the down trend. It may seem like there is hope for Electronics still. We will just have to see how it is going to manifest itself.

5/21/2006

What is the STI doing?

Continue on from my last entry on STI, the plunge for the week is spectacular. The fall of the index was barely supported by the weekly 21 days moving average at 2,495. The drop is very significant, but what does it mean? Are we seeing a correction or a trend reversal?


From the figure above that display the recent daily moves of the STI, we can see that the gaps created an island reversal as named in technical analysis. It marks the beginning of a new wave. Even though from the moves of the last 2 days which tells us that STI is trying to reverse itself, the indicators seem to continue to point south. If this is true the support levels for STI would be 2,450, 2,399. The values is similar with my previous estimation.

While saying that I am still a little doubtful of whether this is a major reversal.


The chart is STI dating from 1998 when Singapore was in recession. Based on the wave count, I am estimating that we are into the minor waves of a third wave. The moves are clear with the counting from 1 of 3rd of 3rd waves to the 4th of 3rd of 3rd wave. Does the the market crash signifies the begining of the 4th of 3rd wave? While I want to believe so, I worries about another aspect of technical analysis, that is the Fibonacci numbers. If the calculation is right, STI won't due for 4th of 3rd wave till the level of 2,938. Terminating the 5th of 3rd of 3rd wave at this point of time seems a little premature. It is a higher possibility that this is only the 4th or 5th of 3rd wave, with its target at 2484 to 2,428.

So is it a major reversal? Answer most likely to be no. Are we seeing the last of the fall this round? I am feeling that it still have some way to go. I do not know what others feel, one thing for sure, my readings on many stocks are still red with very few signs of green. It would be better to be on the side line for a while. Only when STI hits 2,530 then I would likely consider the bear is gone.

5/19/2006

9:00 - 9:30 AM.....


It is always a rush when trading starts at 9:00AM every morning. This is especially so with mega events such as DJIA free fall the night before. This morning is not an exception.

I have bought some share of a company ( I name it "a") the day before judging from a perceived pattern formation just before its closing. I was bullish with the stock as I felt that the STI plunge might already be at an end. But it is unfortunate that the DJIA was in such a bad shape during the night and it resulted in a panic situation when trading started in Singapore this morning (18th May 2006).

first thing I saw on my screen was flashes all over the place, with the pricing all entering the red zone, well, except for one or two that hold their grounds. All the prices including my stock "a" went all the way down by 5% or more. The plunge of "a" went too far from my stop loss level and even I have trouble holding on myself. I even panic further when the trading traffic was so great that the network broke down and I was not able to re-connect to the trading site. I believe at that point of time, the IT room at my broker's place may even have the smell of burning rubber.

It was a scary experience. Eventhough I have experience this before, I still could not get over the panicking sensation. I only have one thing in my mind, "the trading period from 9:00-9:30AM is for the AMATURES!" MY experience told me that there is most likely a pull back after the 1/2 of trade. "a" will reach back to a higher level when the trading stabilize again after that. Sure enough,the price of "a" rised back to a more humane level by 10 and further stabilized by 11.

Again, the same question came into my mind, should I activate my stop loss? Afterall I have set my exit strategy and I need to follow through. With the prices stabilize and volume continue to build in my favour, I waited until 2pm when I find a concrete block sell. I exited the trade with a loss of SGD360.

It is a painful lesson for me. I should never make my decision during trading hours. Some how, I would have to accept the responsibility of being greedy. However, another lesson that continue to re-inforce in my belief system. That is never ever trade between 9:00 to 9:30AM, you will never get a good feel of the market.

The Importance of Stop Loss


One of the first thing that my master told the whole class during the lesson of tehcnical analysis is that Stop Loss (SL) is one of the most difficult thing that we do in trading. It has been something that continue to ring in my mind until now, which is close to 8 years since I was first taught the skill.

It was 1998 that I met my master in technical analysis, I still cannot believe that it has been so long and yet I still cannot forse myself to stop loss on a trade gone bad. It is the most important thing that to be done in order to safe guard my capital, yet every time when my trade meets stop loss level I ponder on whether to have it activated.

I set a very stringent SL level. As one of the book have taught me, set it at a place where you think it won't go. So if it goes there, it means that something is wrong. Indeed the trick is very effective, especially I am setting my SL at energy level. There is just one problem. If the SL is breach, it always speed up its movement, going more than just one bid down, it does a free fall.

Every time I meet SL, I find that there is always a voice in my mind that tells me," it will come back up." But the sad truth is that most of the time, it won't. The SL level is set when I read the charts during end of day. Although the day's movement has some effect on my judgement, but its influence is much lesser than trading time, my reading during this period would be more objective. Unlike during trade when my emotion is governed by every single movement of the stocks I have bought. Activating SL is such a difficult thing to do.

Why do I write this page then? It will give me a constant reminder that I need to ensure Stop Loss is set and executed when necessary. This is the most important part of my system and need to respect. As my master has taught," you are playing only your system and not the market. Only doing so you will eventually win."

5/18/2006

The Market Crash.....

During the last few days, we witness a major crash in Singapore market. Why do I consider this a major crash? to start with, it is rare for STI to move 90+ points downward in one day. The last time we experience this move was event 911.
So what might be the cause of such crash? I have seen may comments that it is due to the interest rate hike in USA, the rise of the USD. However, as a technical chartist, I do not believe in such explanation. The market just correct itself to go further, no explanation, no excuse.
During the mid of April 2006, while analysing the STI, I realised from its movement that it has created an up-ward wedge with aim to retrace to aro 2450. It was an exciting time since Singapore was in the midst of an election campaigning. To my surprise, the index shot up breaking the pattern and caused me to have second thoughts of my technical anlaysis capability.
While STI continued to climb upwards into the 2,600 region, I can't help but to notice that all indicators were pointing downwards at that point of time, I thought there would be a correction coming.
It actually came on the day after the election. STI actually shot upward and the government claimed that foreign investors have confidence in Singapore due to its stability. Unfortunately it has never been the cause of foreign investment but of the works of local investors. STI always shoot up on the day after the election, people just anticipate that it would do so.
STI performance on that faithful day actually created a shooting star candle stick. This is an indication of an reversal. True enough the index has been heading south all the while after that. The fall these few days has dropped STI from a level of 2,666 to 2,478, a whooping 188 points in a week.
So where will STI be heading next? The island formation due to the 2 gaps on 19th April and 15th May 2006 indicates a reversal in place. I have learnt from a more experienced chartist that a strong move will not be a one day event, we would see continuation on the next day. My prediction so far is a continuation to the level of 2,444 ( with support level @ 2,440 ) before retracing towards 2,555 and then revisiting 2,444. This is a calculation base on wave theory. The A wave is still in progress, it needs to complete its journey before changing course. from another aspect of the technical analysis, if base on the theory goes, it will retrace to the previous resistance level, from what I see is the level of 2,400.

5/11/2006

In the beginning.......


This is my very first blog. Actually I took quite a big circle before reaching here.

I find it quite funny for me to actually start my own blog. I have never thought that I would start writing anything for others to read, letting alone revealing to others my thoughts. My essays were terrible during my school time, I evenhave my lecturer told me how bad I was in my GP essay. I still can remember that she told me," you better don't write any essay on politics."

Well, here I am, starting on my own blog, while I ponder upon the question what to do with it.