Google
 
Web thoughts-denzuko1.blogspot.com

My Charting Blog

It is interesting that I start off this Blog when the Singapore Stock Market is heading south. However, this makes it more interesting for me to write on as the market turned volatile. My interest is Technical Analysis, TA for short. I love to look at charts and predicting where they are heading. This blog is or me to record my thoughts on the market. The articles on this blog are based solely on my personal opinion on the charts that I read and readers should not take it as absolute.

9/24/2022

Dow Jones, Nikkei and Hang Seng Up-date 24th Sept 2022

 It has been a turbulent week for the financial market.

First Putin falsifying the reality lying to his people for reinforcement and threaten the world with nuclear warfare, on the other side, the Federal Reserve rate hike of another 0.75%. This causes uncertainty on the financial market, making it a challenge to predict the market. 

I have not done any update on Dow Jones, Nikkei and Hang Seng for quite a while. My last up-date was on 5th Sept 2022 noting the effect of Powell's effect on the market titled the continuing Powell's effect on the indices. While there was also mentioned on the sudden drop of the indices in the sudden plunge of indices last night and present status of currencies, the entry focused more on the currency fluctuation.

I was a little reluctant for the update on the 3 counters the last 2 weeks. For one, it was too short a lapsse time and the counters must be allowed to work their courses. 

How have the 3 counters developed the 2 weeks since?


Fig 1. Dow Jones Weekly Chart

Dow Jones continued to move in alignment with the prediction of the continuing Powell's effect on the indices. In fact, there is momentum in its move, and firmly broke through even the 144-week moving averages well as the previous low.

It is only stopped by the Bollinger envelop this week but stayed outside the band. It might have a little difficulty next week to decide if it is going to stay outside or come back in. 

Base on the latest development, the full wave measurement (in red), support lies between 26,982 to 29770. while the minor wave measurement support level can be found at 28,442. These levels base on projection measurement.

In addition, I can use the same set up to come up with the expansion support, while lies between 22,354 to 25142.

Let's move on to Nikkei 225.

Fig 2. Nikkei 225 Weekly Chart

Even though Nikkei 225 seemingly affected by the drastic drop in Dow Jones, it nevertheless reluctant to follow full heartedly. It is stopped by the 89-week moving average. The situation on Nikkei is not as bad as Dow Jones. 

Even dropping below the 89-week moving, there is still one more layer of support at 144-week moving average. 

However, based on the counterwave upward, it is possible to see a 3 waves movement with a 3-wave B wave that formed a rectangle. I will still have to assume a possibility of a downward C wave. 

Using projection measurement, support level is seen between 23,108 to 25,443. In addition, I can use the same set up for an expansion support at 18,567. 

The expansion measurement is quite scary, it is close to a 50% drop from its top at 30,795. On a personal level, I believe that for this to come true, Nikkei has to break the low of 24,681. no matter what it is still one of the possibilities.

what of Hang Seng?


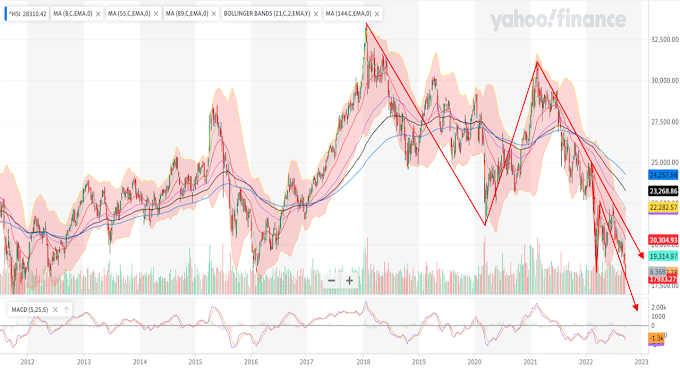
Fig 3. Hang Seng Weekly Chart

I did an entry on Hang Seng monthly chart earlier in The HSI monthly chart. However, I pondered much about its more short-term objectives. First of all, there was a strong rebound, this followed by a more sluggish downward movement. In addition, Hang Seng was reluctant in crossing the previous low.

This let me believe that there is a possibility that Hang Seng might correct before its continuation down trend as I described in the continuing Powell's effect on the indices

The move this week changes everything. It crossed the previous low, making it more certain of its continuation downward, it is less likely to correct upward.

There are actually 3 set ups that I can use for Hang Seng. There are 2 projections, one of which Hang Seng has reached, lying between 18,838 to 23,553, the next level, 127% projection will support at 15,480.

Using the minor wave measurement, support level at between 15,708 to 18,311. Hang Seng has penetrated the upper end of this zone.

At the present moment, I can also utilize expansion measurement, support level is between 11,420 to 14,023.


Labels: , ,

9/22/2022

A reading on Russia Moex and Ruble

Ever since the beginning of Russia's "special military operation" or in another word " Invasion of Ukraine", my impression on Putin and his action is negative. It is not because I am against war, war is part of human nature.

If there is one thing I dislike about Putin's action is because he kept violating the rules of war, causing heavy losses for his country. While not focusing on the Russia-Ukraine situation, I have some entries on my view in my other blog The Holistic Side Of Life (holistic-denzuko1.blogspot.com).

As this blog focus on technical analysis, I gather that may be I should check up on how Russia is doing on its stock market and currency. It gives an indication if it fares better or worse after the war started.


Fig 1. Ruble Weekly Chart
We can see from the chart that Ruble shot up when the war started.

While US and the west tried to sanction Russia, causing the weakening of the Ruble reaching a level of 160 per USD. Russia managed to hold the world hostage with its oil and natural gas supplies. This led to Ruble shot back up and Putin laughed at US on the uselessness of its sanction with Europe reluctance to follow, they have high dependence on Russia gas.
72.49.
Ruble has since then hitting a new high of 50.5899 per USD on 26th June 2022, much higher than the pre-war period. 

At the moment, I find some difficulty reading this chart. Ruble came a long way down and with insufficient movement to indicate its next cause of action.

What I can see is a slowing down of its momentum after its congestion in April 2022, the bars continue to overlap each other thereafter. Further to that, there is a very minor zig zag pattern. Using this for measurement, possible resistance at between RUB65.65 to RUB72.499. This coincides with the moving averages entanglement presently. 

If I am to move further, the retracement measurement indicates further resistance at between RUB74.94 to RUB90.40.

At the same time, I am seeing moving averages in place indicating continuation instead of reversal. So it is possible that Ruble might continue to strengthen of the currency.

For the time being, it is still too early to come to any conclusion. I have to wait for more movement before I can see a clearer picture.


Fig 2. MOEX Weekly Chart

Moex movement is cleaner, yet I am also receiving conflicting signal from the chart.

Moex plunged after the invasion started, it has since corrected but continued its downslide thereafter. However, the movement lacks momentum and reversed at the end of July 2022.

For some reason, the technical set up at one point indicated Russia market was improving amid the invasion and sanction. Even the last 2 weeks, it was only pausing and rested above the 21-week moving average. Something happened this week caused the whole movement to collapse. It must be the anticipation of what Putin might want to convey in his speech to Russia. 

Using the RED line set up, I cans see support for MOEX at between 1,597 to 833. At present, I am seeing lower high with moving average stopping MOEX from ascending, it is higly likely for MOEX to reach this new low.

What if MOEX somehow decided to scrap it and climb further, then resistance can be seen at between 2,735 to 3,176. These levels coincide with the persent locations of the higher moving averages.

Labels: , ,

9/19/2022

The result of multiple years of political turmoil in Malaysia

 I have just typed out an article on MYR during the weekend titled Malaysians are getting poorer...?, Then I saw this guy kao bae kao bu (cry father cry mother) on market opens in Malaysia. 


This stirred my interest in this index today, so I took a look.

Fig 1. KLSE Daily Chart

For this analysis, I use the daily chart as it shows a more detail picture of the index. Seems like the market really did not like Harapan, it continued to head south the whole time that Harapan in power, only to be saved by Covid-19. 

Unfortunately, the uptrend was short lived and ended by the end of 2020. In between 2020 till the first quarter of 2022, a head and shoulder is completed, neckline not only broken but also retested before it continued its downtrend.

There are 2 set ups I can use to measure its support levels, zig zag which I consider not so appropriate, and expansion that I believe is a better choice.

Let's go for my favorite projection on thee "zig zag".  Support for KLSE at between 1,484 to 1,400. It has so far breached 1,484 and heading for 1,400. 

Using Expansion, it would be more for the minimum objective of the head and shoulder formation.  the support level is much lower at between 1,339 to 1,255. This is very close to the 2020 bottom.

I really do not want to go further on this. In a much bigger set up with the high of 15th April 2018, KLSE might sink all the way to 1,000. I would prefer to go for the more immediate support or resistance, they are more relevant.

If you zoom in on the chart (using finance.yahoo.com, you will find continuous gap down, meaning that there is momentum downward. Tendency of reaching its objectives is high for the time being.

Labels:

9/17/2022

Malaysians are getting poorer...?

 I want to talk about Malaysian Ringgit (MYR) today. The constant complaints recently on youtube.com that feature Malaysia political situation kept talking about weakening MYR leading to inflation. This causes goods becoming more expensive to the locals.

It is quite true, my travel back to KL has increased in frequency after rules were relaxed, I experienced on my return each time that things were getting more expensive, especially food. 

There was this noodle stall that was my favorite. Its bowl of noodle used to be MYR5.00 before lock-down and it is now MYR8.00. This is an increase of 60%! 

I didd a piece of article on Asean's currencies including MYR titled All the disruptions....and is Asean in trouble? in July 2022, I compared MYR with SGD then, I estimated the next resistance for MYR to be between MYR3.25474 to MYR3.32340. It apparently breached the lower resistance level on 11th August 2022.

Today I will conduct a more thorough analysis of MYR comparing it to both USD and SGD.


Fig 1. MYR Weekly Chart

MYR was in a congestion band since 2017. I find it quite interesting as at certain point of time between 2015 till 2018, it was very close to breaking the neckline and it came true. We would be having a very different reality now. 

It coincides with the last general election of Malaysia. It seems like the market did not like the coalition that took over BN and know that it would be a disaster.

Since then, a multiple-year triangle was form and break-out happened on round 8thMay 2022. Using the triangle formula, I see an objective of MYR5.009 per USD.

This is a strange sensation for me, I have heard about MYR5.00 per USD. It was a joke that my teacher told the class during my technical charting class. 

The joke went like this:

" It was 1998 and in the midst of the Asian financial crisis, Soros and his team of fund managers were attacking the Asian currencies, MYR was depreciation fast. 

The prime minister at the time, Mahathir, called Soros and said, " Mr Soros, the situation is getting very serious here right now. The outcome is not going to be good. How about we arrange a meeting for a discussion and see what we can do about it?"

Soros agreed and said, " I'll see you at 5 then." "

Of course, MYR5.00 per USD did not come true then, it was close at MYR4.70. Mahathir played punk and fixed the exchange rate at MYR3.80 per USD, he also limited the outgoing MYR to MYR10,000 per person per time to stop the bleed. 

It worked but with a bitter aftermath. The integrity of Malaysia's economy took a hit and investors shy away for years.  It was one of the last countries to fully recover from the finance crisis.

Let's get back to the chart on the Fibonacci set up.

There are 2 possible zig zags that I can use for this counter.

Using set up in blue, I can see resistance at MYR4.80 to MYR5.40. 

As for the shorter term set up (part of the triangle), resistance at between MYR4.359 to 4.585. MYR is presently within this zone. At the same time, the 100% expansion measurement indicates resistance at MYR5.035. 

For the time being, all indication is heading to MYR5. 

Seems like Soros is going to meet with Mahathir after all.

Let's move on to SGDMYR, this is closer to my heart.


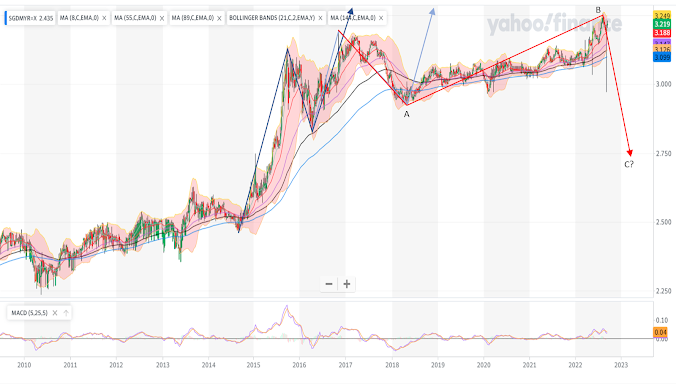
Fig 2. SGDMYR weekly Chart

The behavior of this pair is different. There is a long stretch of congestion between 2018 till 2022 and MYR is seen weakening further. It seems that SGD is a much stronger currency and manage to withstand onslaught of USD more than MYR.

However, I nevertheless feel a little troubled as I am seeing slight contradiction on the chart.

Let's look at the positive part of this chart first.

Again, there are 2 Zig Zag set ups that I can use for projection measurement. Using the blue set up, I can see resistance at between MYR3.2208 to MYR3.4630. It broke the lower resistance level, retreated and now the same level is resisting its ascension.

Using a shorter term set up, the more immediate resistance level is between 3.15442 to 3.2950. 

There is one question here, if the lower level is crossed, why would I still mention this?


Fig 3. SGDMYR 4-Hourly Chart

 It can be seen on the 4-hourly chart that these levels do affect behavior of the counter.

I mentioned about the troubling factor, what is it?

It has something to do with the chart behavior itself. Considering the RED line in fig 2., I can't help to consider the possibility of a counter wave after the ascension (or in this case, the descension of MYR). 

The loooonnnnggg stretch of congestion between 2018 till now is a possible B wave of the counter wave pattern, and we might be seeing C.

As can be seen from Fig 3, the recent movement of the pair seems to show some kind of failure in its climb and MYR is testing its 55,89 and 144-moving averages with weakening of 8 and 21-moving averages. 

While the weekly chart maintains its strong support of further up-trend of the chart, it is worth taking note of such signals as the chart is trying to tell me something.


Labels: ,

9/14/2022

The sudden plunge of indices last night and present status of currencies

 I was lazing at my station last night with the Dow Jones Chart turned on. I remember it was around 8:00PM plus (Singapore time). I was watching some video on Youtube.com when all the sudden I noticed a sudden plunge on Dow Jones 3-minute chart, it was exactly 8:30PM. 

I was taken aback with the sharp descend. While I faithfully follow the principle of technical analysis which discount any fundamentals, I can't help but to think, " what happened?"  

I quickly check on other indices and I found similar situation even on Nikkei and Hang Seng. I even checked on the German index DAX and the same thing happened, there must be an event that shook the market.


Fig 1. Nikkei225, Hang Seng and Dow Jones 3-minute chart

Turn out there is a Fed report that while the rate was raised, inflation in August was above expectation at 8.3%, rose by 0.1% compared to previous month.

Anyway, as I have said, I was lazing. I was too tired to do anything about it, Furthermore, this may lead to congestion, and I was not really keen on Dow Jones as it means mid night trading for me.

As for today, my main intention is on currencies as there has been much hype about weakening currencies. Already many experts have been telling people that it is not the weakening of the currencies of their countries, it is the strengthening of USD. This was also what I mentioned in What is USD doing?

I will focus on 3 currencies today to determine where they go: JPY, EUR and GBP. Even though technical analysis supposed to enable quick analysis, it does take time to analyze each chart.

Let's start with JPY since there is so much warning from youtube.com videos that JPY is very weak against USD even though it is known as a safe haven currency. 


Fig 2. JPY weekly chart

Based on my interpretation, there are 2 zig zag patterns and, in a way, form a double bottom, so there are 3 measurements. In the long run (blue zig zag), it has already crossed the 61.8% projection at 136 and heading to 146. 

we can ignore the other zig zag as well as the double bottom. The objectives were much lower and surpass.  

Breaking146, the next level of resistance is 159. Will it go further than that? Possible, but let's focus on the more immediate ones first.

Let's move on to EUR.


Fig 3. EUR weekly chart

Interesting enough, there are also 2 zig zags and one double bottom (more like a triangle). 

With the longer-term zig zag (in blue), it has already past the 61.8% projection at 0.9505, the next level of resistance is the 100% projection at 1.046 and 127% projection at 1.114.

 As for the double bottom (or triangle), the resistance is even further at 1.082.

As for the smaller zig zag (in green), the next level off resistance is 161.8% projection at 1.041.

So 1.04+ is really one level to watch out for.

Finally, let's move on to the last currency of this entry, GBP.


Fig 3. GBP weekly chart

Unlike the other 2, GBP lacks the formation of double bottom (or triangle). There are only 2 zig zags that I can measure with projection.

Using the longer-term zig zag (in blue), the 100% projection resistance at 0.948 while 127% at 1.0165.

The more immediate set up on the other hand, resistance at 100% projection is 0.877 while 127% at 0.9246.

While the oil price is kind of stabilized in US, it is because of a stronger USD. For other countries however, we will continue to see higher prices on oil, unfortunately.


Labels: , , , , ,

9/10/2022

Coming back to Microsoft

 It was quite some time ago that I have an entry on Microsoft, it started with a conversation with my sister-in-law. As a result, there were 2 entries on Microsoft titled Microsoft.... and Microsoft follow-up at the beginning of this year. 

At the time, I estimated the support level of this counter at 267 and if fail, will reach 228 to 247. Since then, it reached and hover between 247 to 267 (give and take), rebounded upward. before another reversal by 14th August 2022.


Fig 1. Microsoft Weekly Chart

Since its reversal, Microsoft has been on continuation down trend. The chart demonstrating lower highs and lows and presently went below the 89-week moving average. Furthermore, its downward movement comes with gap, indicating momentum.


While it attempts to retest the said moving average this week, it remains below the support turned resistance. Not only that, it also fails to exceed the high of the previous bar. 

I believe that Microsoft have more downhill descend.

With the present set up, I can see 2 possible projections for Microsoft, one from top and the other from previous high, the more recent zig zag is more relevant to estimate its support level.

Using the larger zig zag set up, the support can be seen between 186 to 227. Is this a viable level? will Mcrosoft reach this level?

What if I use a shorter zig zag set up? The support seen from this level is between 219 to 248. Microsoft is close to reaching the higher end of this range.

Again, 247is a significant level as this is the previous low of Microsoft.  So breaking this line will make the longer term support more viable.


Labels:

9/05/2022

The continuing Powell's effect on the indices

 well, I am still in the midst of my trip in Kuala Lumpur and so, still no trading because of too much erants.

However, I feel that I need to have an up-date on Dow, Nikkei and Hang Seng to maintain my attachment on the market. I will still limit my review on the 3 main indices I am focusing on.


Fig 1. Dow Jones Weekly Chart


Dow as it seemed did not pause last week after crossing and instead continued its journey downward. Apparently, Powell's speech was kind of difficult to digest.

The momentum is still strong as the bars barely crossing each other and it is now resisted by the 8 and89-week moving averages.

I did a projection measurement base on the latest set up and the next level of supports are 28,544 and 26,982. But one important point to note is the previous low of 29,653, a minor correction might happen at that point.


Fig 2. Nikkei Weekly Chart

The turbulence on Dow Jones has certainnly affected Nikkei, causing it to gap down and 'plunged" only to be supported by both 21 and 55-week moving averages. 

So far, Nikkei is the only index of the 3 who is still floating above the moving averages. and based on figure 2, there are a few possibilities of projection reading, blue line projection leads to resistance of 29,177, which was reached on 14th August 2022. It has since reversed due to Powell.

So the next measurement on the same set up leads to support level of 27,007 to 26,404. Now, based on the present wave structure, is this a viable level?

With the present development, it is possible that Nikkei might drop further. The Zig Zag movement give me the feeling that it is in a B wave so C may be much longer and crosses the bottom of A.

Thus the red line projection reading.

 The support for this set up lies between 25,443 to 23,108.

However, you can call me out for being bias. Of the 3 indices, this is still the only one floating above the moving average, with exception of the 8-week moving average. There is still a chance that the projection estimation may not come through.


Fig 3. Hang Seng weekly Chart

We finally come to Hang Seng index. While it has been consistent so far staying below the moving averages, the set up since 13th March 2022 (a reversal indication) it gives me a feeling that Hang Seng is in a correction phase. 

There are more indications recently with continuous congestion since31st July 2022. While Powell's speech shook the world, it did not cause Hang Seng to go lower, but instead staying within the congestion band.

It is therefore possible for Hang Seng to move upward at least towards its 55-week moving average with formation of a rectangle.

If based a projection setup, we see a resistance between 22,548 to 23,466, where present 89-week moving average lies. But 22,523 is a level to watch out for as this is the boundary of the rectangle formation.

If I conduct a projection measurement using the rectangle formation, the support levels are 20,381 to 19,104, which explain the present congestion.


Labels: , ,