Google
 
Web thoughts-denzuko1.blogspot.com

My Charting Blog

It is interesting that I start off this Blog when the Singapore Stock Market is heading south. However, this makes it more interesting for me to write on as the market turned volatile. My interest is Technical Analysis, TA for short. I love to look at charts and predicting where they are heading. This blog is or me to record my thoughts on the market. The articles on this blog are based solely on my personal opinion on the charts that I read and readers should not take it as absolute.

6/28/2006

Chain of Coincidences


It has been quite a bad week for me, starting with falling sick due to flu virus, causing aches at the joints of my bones. Then my modem was down*sigh* However, something good did turn up due to the pause, the STI is allowed time to create a pattern for clearer reading.

During this period, it has an opportunity to develop an ascending triangle, theoretically, this pattern means an up trend. The measurement would result in STI heading for 2,438. However, in the case of possible down trend, it will hit 2,212. For the time being, I will bet onto the higher probability which is up.

The indicator is kind of mix, with RSI turning south while Stochastic heading North. Recently I learn to sit on the fence until clearer sign is given to me. At the moment, there still seem to have confusion in the market. However, in general, the trend is still up for the time being ( indicated by MACD ).

STI will still be affected by the few support level. At present it hovers at the support of 2,355. Next level is 2,398 and follow by 2,451. Well so far so good. As for the influence of the Fed with many expecting a rate hike, my take is that the market already factored this in, so it may not have a great negative influence on the market in the end.

6/21/2006

Gap fully covered

Figure 1 STI Daily chart

I feel that I am slightly out of touch these few days after returning from my oversea seminar on bathing. Of course I took more time in taking my bath now as I have found the relaxation that it provides. The charts on the other hand is slightly out of phase with me and I need some time to get used to them.

I was still quite bullish yesterday when I saw that STI was supported above the gap. Unfortunately today it gave me a warning sign with fully covering its gap. It indicates that there will be very limited upside as a full covering of the gap means weakness in the direction it is travelling.

The RSI has been coming down for 2 days now, Stochastic is still showing an upward movement supporting the up trend. It does makes me wonder if the A of B wave have already completed and now it is doing the B of B.

There is a possibility that STI will retrace back to its previous low before moving north. What I see now is the resistance at 2 places, 2,355 and 2,398. STI might find it a little hard to reach 2,398 since the 21 EMA is resisting at 2,381. The nearest support for STI is 2,260.

While I hate to admit it, it seems like bear is confirm with the 55 days crossing 89 days EMA from the top at the level of 2,450, happens to be the next resistance level.

Although an island reversal has been created, it was quickly followed by an Harami with confirmation, the turning is rather fast. As such I should now expect more south migration with support levels as mentioned earlier.

6/19/2006

Minor congestion

STI has done little change in its movement today. It did a minor retracement of yesterday's move. However, it did not attempt to cover the gap created yesterday. This is something that I find much relief of. However, it is important to note that in case STI wants to come back to cover the gap, a full cover would spell weakness in this index.

Art present moment, I am still bullish on the index for the short term, especially when today's move is met with very low transaction.

6/18/2006

Island Reversal for STI


Fig 1 STI Weekly Chart


Fig 2 STI Daily Chart


Fig 3 Properties Weekly Chart

It has been exactly 1 week since my last update on this blog. I was away for a course in Malaysia on taking bath. Not that I do not know how to do it, but its application on health. Seems like the tide has turned while I was away. when I came back on Friday, I virtually could not do anything except to watch the STI moves. One thing I have promised myself is not to do anything unless I have looked into my chart, which is one of the short fall of my system.

It seems now that the tide is turning with the completion of the A wave. The indicators on the weekly chart is reversing. the downtrend is now supported by the 89 weeks EMA @ 2,267. However, now support turn resistance at those levels that I have mentioned earlier, mainly @ 2,398 and 2,455, 2,351 has just been shot through.

On the daily chart, the index gapped up, mirroring its top formation. Again we are seeing an island reversal. The gap up comes with volume which I find is encouraging. The indicators for the daily chart are also pointing north this time. The resistance level comes from the 89 days EMa which is presently hovering at 2,455. I believe this is where the STI might be stopped.

Now one concern I have it the STI breaching of its supporting trendline, now a resistance to its progress. throughout the years, I understand that breaching of the trendline may not mean trend reversal. The thing is that there tends to be 3 trendlines at various angles, 30Deg, 45 Deg and 60 Deg. It is likely that STI may progress to a trend of lesser gradient. Further more, I have also found that the moving averages also makes a good candidate for a trendline. I find it to be more reliable.

Earlier I have noted down that I could not yet declare for myself that the trend is turned and bear has set in. On a daily basis, 55 days crossed 89 days EMA marginally. However, I am finding the crossing to be quite shallow still, so monitoring is needed.

I have also attached to this blog the properties index. I find it quite interesting when compared with the STI. When looking at STI weekly chart, the previous high actually failed to support the drop and only stopped at the bottom of A of wave 4. I somehow feel that this is a weakness in STI. Although officially we are moving up ward, it is worthwhile to be caution. Property on the other hand is well supported by its previous high. This makes me feel that it would be safer to put my money into stocks relating to properties. Why only properties? Unfortunately when I scanned though all the indices, this is the only thing that caught my attention even though most indices are pointing up wards ( except Construction sector ).

6/11/2006


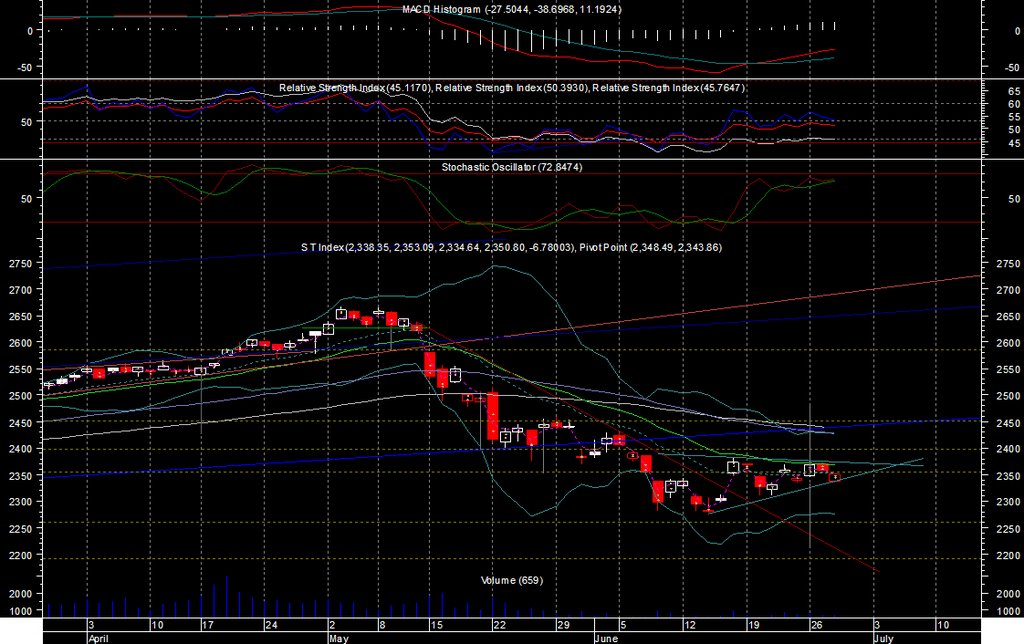
Fig 1. STI Daily Chart


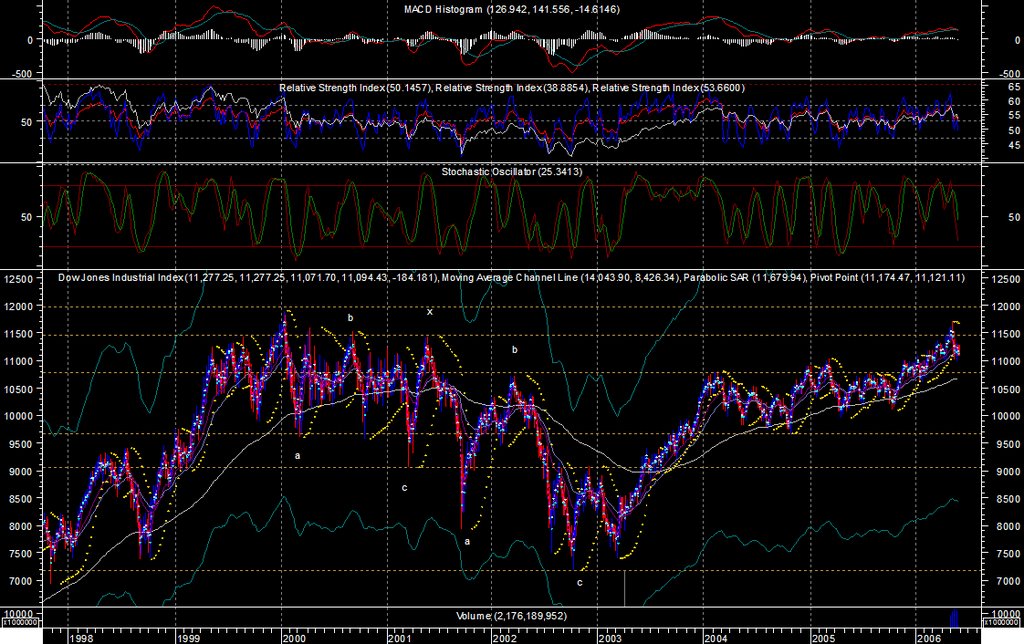
Fig 2. STI Weekly chart

I have to apologise to the forumer where I borrow this title without asking. Hope that he won't sue me for copy right. Up to now we have already experienced 5 weeks of sell down, started on the week right after the Singapore Election. There are now a lot of mix signals in the forum on whether we have actually hit bottom for this round. Many as I have seen are quite delusioned about prospect of an up trend although there are still a few who is getting more bullish, with me as one of them.

I was disappointed with the week's performance as I have predicted a reversal during the week. It never came. However, as I can understand from my experience is to repect and fear the market. You can play with your system but never play with the market, some thing that you will never win.

So pride swallowed, I move on. I stopped loss on one of the only 2 stocks that I am holding at the moment, Tiong Woon which has broken its support at SGD0.25. Some forumers were puzzled of my action as they are seeing the stock is at historical low. I see it differently, 0.25 has been supporting this stock for 2 weeks showing that it is a strong support point. Breaking downwards means risk of further down slide. I normally put my stop loss at support/resistance area, so once broken it is some time difficult to catch the stop loss level. would I be wrong about Tiong Woon? I might, there were times when a stock that I have dumped shot right back up, there were more times when it went further down. So I would rather be safe than sorry for this.

With this side line settled, are we at the bottom yet? Its not easy to say still. In general I believe that we will be on continuation downwards after an up trend that do not exceed 2500 so to complete the A, B and C wave. I am a little unsure of the completion of A wave as my calculation varies depending on which point I use for the top of wave iv. If it is 2,459, I see 2,279. If it is 2,430, I will get 2,252.

The indicators on the week chart are also not very encouraging, RSI seems to have reached the bottom but fall short of a reversal, Stochastic is at the bottom and on a verge of crossing up ward. Both of them still need the coming week to confirm their directions.

The Daily chart is more interesting, both RSI and Stochastic has again turned upwards. They did so a few times during the past few weeks. but the difference with this week is that by Friday, the chart is forming a potential Harami pattern, upwards. Confirmation is needed on Monday to determine that this is true. Further more volume is stronger this round. Now if these few factors are available by Monday, including higher highs and lows with higher volume, it will be very possible that we are seeing a B wave upward.

So fingers have to be crossed on Monday. However, it is unfortunate that I will be oversea this week for courses. I will not be able to monitor the stocks and index properly until Thursday evening*sigh*. Anyway, the support and resistance levels are still at these areas 2,279, 2,355, 2,398, 2,451.

6/09/2006

Continue on to the next level for STI


As I am still waiting for the confirmation on a bear in STI. I was quite surprise today that both MA still have not crossed. Probably I am still a little impatient and can't wait to enter a bear market.

The move was quick, STI gapped down at starting bell and fell lower today. I thought last night that it maywant to take a breathe before proceeding but now STI said I still got strength to go lower still. With its international companions, it plunged towards the next level of support at 2,260-2,270 which I have mentioned last night.

A forumer from CNA was in a little disbelieve about reaching this level so soon when I mentioned this to him/her a few days earlier. It now seems like a possible level to reach. STI stopped its descend at 2,282 before moving back up. So will it move downward tomorrow and test 2,260-2,270? It is possible.

The move today effectively reverse both RSI and Stochastic downward. Similar with MACD of STI although it has demonstrated a divergence. From the pattern of the move, it seems likely that this is wave 5 of the A wave. If I use the calculation of a 5 wave movement, 5th wave of A wave should head for 2,279, which STI was close to this afternoon. If this is so, I believe that it may surpass this point but supported at the region of 2,260-2,270.

One thing that I notice is a sudden increase in volume for STI. This is fairly unusual as compare to the last few weeks. One question that I have in mind is whether this is a selling climax. If this is so, then we should be seeing the end of this move soon. Anyway, if it is true that we are nearing the end of the 5th wave down, the only thing left is up.

6/08/2006

Disappointment to many


I was reading the CNA forum today, with not much mood for participation. For one thing, I am rushing to complete a project. I only manage to have a glimpse at the price movement on my computer screen. Secondly, I was not in a very good mood because STI went south. I was actually bullish until this morning.

It seems like there are a lot of disappointment on both STI and performance of the stocks that they are in position. The atmosphere became even more intense when STI hit 2,349. I can virtually sense the fear in people for STI to drop even further. I was quite amaze that it was eventually supported at 2,355, a resistance level that I have previously mentioned, many times.

Looking at STI, I am suppose to accept that the bear has set in since now it is quite clear that it has moved away from the trend line resistance, heading south. However, I am a little stubborn on this and insist to wait for the crossing of 55 against 89 days EMA ( grey and white line ). Since I have accepted this system, I have to follow. However, I believe it may not take long since the recent moves have been very davestating.

It is very easy to see how well the STI is supported and stopping where it should be, reason? These are areas where STI has stopped in the past. As rule 3 of TA mentioned that history repeats itself. It has to do so. However, as STI move downward, I find that the volume continues to shrink. In fact there are barely a few trades happened when I monitor the movements.

It is also interesting to note that the index stocks along with some high profile stocks were the ones being hammered down, there were little influence on the small caps. In fact most of my portfolio are in the green as what I have recorded from my reading yesterday.

So will STI be down tomorrow? It is difficult to say when the indicators are slightly conflicting. I would feel a weak but well supported STI above the level of 2,350-2,355. The indicators are still pointing downward to tendency for pressure to prevent it from coming up. If it is going higher, I believe 2,398 will be a resistance this time round. Small cap stocks may quietly climb upwards. If it breaks down further, next support level at 2,260-2270.

6/06/2006

STI's resistance to world market influence

Its been a few weeks since I have started this blog and I am quite happy that it finally reaches 1,000 viewings. I am also grateful for a few of the readers who not only read but also help contribute to improve either my reading and blog presentation. I have been pasting the chart for quite a while already. Today I feel like stopping the chart display for a day, and rather just put in my discussion on STI.

I was watching CNBC before writing the blog for today, US stocks have been coming down further today in response to the comment from the head of Feds. It appears that the interest rate is finally taken a toll on the US market, especially on housing and property. It continues to tumble from the 290+ points fall yesterday and the last I check DJIA was below 11,000 for the first time in months. The interest rate now would be quite a significant influence. I seems like the US Feds wants people to save more money.

Remarkably, STI did not fall as much today as many have thought, it barely scratched 31 points before it rebounded. One reason I can think off is that it fell way before others did ( including DJIA ), right after the election. Just as what TopTrader mentioned, it is at an over sold region. While observing the moves of many stocks today, most of the non STI related stocks did not budge much. It seems to indicates that there are now very few sellers in the market.

Another indication can be seen from the forum. Many weeks ago I am still seeing the word bargain hunting, I am no longer seeing that. In fact many are wary about further drop of the STI and their stocks. With the short term traders off the market. What left are those with holding power. Will STI continue to fall, it might but the volume of trade is already at its minimum and falling down further will be an up-hill task.

While going through the chart of STI, the indicators are showing conflicting messages. With RSI rising up while Stochastic reversing down, both below 50% mark. Again it diplayed another spinning top and a possible morning star. It is highly possible that STI will again move up with the US market down.

I am still optimistic at the moment that STI will be in positive area this week base on the weekly chart reading. If it is going to achieve this, tomorrow is a good day to start.

6/05/2006

STI Struggling to stay afloat


It is quite a frustrating day today. To start with I am not following routine today. I am escorting my parents going arround meeting some old friends. While I am not having access to the internet, the index and many stocks went counter trend, one stock actually broke through my support level and trigger a stop loss. Then the worst thing is that this is my second time writing this blog, something happen when I submit the blog the first time round.

So with all the unlucky events on me today, what is the STI doing? It is doing a correction, a little earlier than what I have expected. I was anticipating a round off before it reversed. Anyway it is good since the recent rise was a little too rush.

The down turn has still not cause a turn in many of the indicators that I have used. Only RSI is reversed while Stochastic and MACD is still diverging up ward. I would feel that this week would still be good for the Singapore market.

The resistance still remains at 2,398, 21 days MA and 89 days MA @ 2,470 and 2,484 respectively. I would not consider a bear yet for STI as 21 days vs 89 days is still not as reliable as 55 days vs 89 days. But 21 days is a good indicator as a resistance level at the moment.

My worry is that STI is struggling at the trendline. This is not very good as it is continued to be tested. It is a sign that STI is weak and a reversal may be coming soon. Presently it is lying below the trend resistance of 2,413. If unable to break this trend, we would see a longer south migration.

6/04/2006

A clear picture for STI

I have received a comment on my blog regarding the problem with the small pictures and not able to see clearly on the chart. Thanks to Leo's advise I am trying out a new service provider. Athough I don't see a clear picture attached, a bigger picture can be viewed when clicked.


After a three weeks a turbulance, we are finally seeing some light at the end of the tunnel. By this I do not mean dying but more like a possible rebound. I am actually quite amazed as the chart itself gives very clear signal on where it is going. The accuracy of the read does depends on how much of all the tell tale signs given by STI. So far my estimation only base on reading STI alone and not linking with the DJIA, Nikkei or HSI. So it proves to a certain extend that what ever is happening, the chart factors in already.

On a weekly basis, STI has formed a hammer, indicating a reversal. There is still a need for confirmation from the peice movement. The leading indicators RSIand Stochastic are on a verge of turning upward. This show sign that at least for next week, we may still be going up. The week ended with STI stopped at the resistance level of 2,451 while supported by 55 days moving average at 2,367.

The down trend on the other hand is not at all supported by the volume, which has been deminishing all this while. I believe this is very important as it gives indication of the sentiments for STI.


While STI looks positive for weekly trend, what of the daily moves? So far it is on an up trend, with all indicators trending up, except for RSI which is turning up ward. Volume starts to increase when the index ascended, however, it is still early to tell the whole trend.

One caution that I still have is the urgency in the ascenssion. I am so far targeting 2,490 as a valid resistance, STI is going up too quickly. With the expectation that this is only a B wave, I feel that it may not retrace to the level of 2,666 yet. The candlestick pattern is also worth noting, it is a spinning top which shows that STI is still unsure of its direction, meaning that it will most likely to depend on the next day for confirmation.

However, with the positive signs from the weekly chart, I believe STI will in general be on the up trend it may congest a while at 2,451 level but eventually should hit 2,490. I am looking at ultimately 2,585 level for STI, but that is for the future. I will be looking forward to what STI will unweil to me next.

6/02/2006

STI Entering Bear?

The move from STI today is rather disappointing. It started with an agressive climb of over 30 points in the morning and gradually recline back to below the 2,398 mark @ 2,386. After the morning star yesterday comes the shooting star, creating confusion to my chart read. I will have to revise my reading of STI.


Today marks the crossing of 21 days to 89 days EMA. Giving further signs of weakness. However, this may not mean the STI officially entering bear due to the 21 days EMA's volatility. If 55 days crosses 89 days EMA from the top, it would be the first time they meet since 2003, at the begining of the bull run. The MACD on the other hand, has been showing divergence to STI, still supporting the notion that a reversal upward is near.

The RSI although having a divergence indicating possible up trend soon, is coming back down, probably with higher lows. This may not mean that STI will not go down further, but increasing possibility of uptrend after that. As I have recorded on previous note, we have a support at 2,355. While seeing the latest gap as exhaustion, the gap measurement still points towards this level.

It is therefore possible that STI will still go down, likelihood with a congestion at 2,355 before reversing itself. Close monitoring is needed for the next few days and tomorrow needs to be an up trend to break the pattern for Shooting Star.

While I was worrying about the volume, I also realize that although it has not support the recent up trend. It has in general not supporting this down trend. The volume has been diverging with the downward movement. It has now reduced to almost bare minimum, which I recalled one forumer's comment as pathetic. Therefore we may see stronger wave upward, soon.

After all these said, what is my feeling for STI. The weekly is clear with the down move for this week, which STI daily has fulfilled. The volume is deminishing with the whole trend, with the lack of support, STI will rebound. We may still see some southward movement but I feel that it is limited as STI would enter a congestion period, supported at 2,355. The resistance level now is 2,398 which I feel is a strong level and STI needs increasing volume to break through, same with 2,451.

If however STI moves northward tomorrow crossing the shooting star, I feel that it would be a very positive sign.

6/01/2006

China Sun

A friend asked me to look at this stock for her friend. I normally don't do this but since I have made a promise, here it goes.


The share came a long way down with a double top. Its move so far has met the objective (grey line) and went further. Looking at how the stock ends, I feel that a wedge is formed on the hourly chart. Base on my measurement, it should bounce back to 0.70 first. Both RSI and Stochastic is showing signs of reversal. So I am pretty positive about this stock at the moment.

The only problem it has is the moving averages which is now on top of its head. They act as resistance to its move, so there is limited space to grow, unless this stock break through the barrier.

A few international indices


Someone from the CNA forum asked me to look at the indices today as panick is everywhere. It is unfortunate that I did not suscribe to the data. So I need to second source and the conversion is very troublesome.

Anyway, I have managed to get data for DJIA and N225. But they are not updated for 31st May 2006. So what I will do is to look at weekly performance for a longer term analysis.


Its been a while since I last touch DJIA. I was amazed that it completed a complex 4th wave (abcxabc) and have since moved on. At present moment, it has difficulty in crossing the previous high. The formation is rather messy and more time is needed for detail analysis. In a big way, I don't like this chart. It is in a congestion mode and if it turn downward and crosses the 7000 mark, next destination at 2,500. On a minor note, RSI and stochastic is moving south, so there will be south migration. The downtrend will continue until indicator change courses.

Short term support for this index is 10,767.

The Nikei 225 has done a reverse head and shoulders but forgot to touch the trend line before moving on. Now it is coming back to complete the job. Divergence is seen on both RSI and Stochastic, therefore supporting its down turn. However, I suspect that its fall will be stopped by 14,557.

STI don't know where to go.

I read from the chart last night that the STI is ready for another plunge, I was expecting a more gradual move. It's agressiveness however took me by surprise. Opening with a gap down at 2,381 which seems to be an unregistered support line.


Although the plunge was serious, its behaviour seems somewhat lost. It still cannot decide where it is suppose to go. In candle stick this is called a spinning top. So is this a good sign or bad?

If base on candle stick theory, it still needs tomorrow to decide how good is the setting. An up trend will in effect create a morning star, indicating a reversal upward.What of the classical TA? Its pattern has not justify a reversal day since neither long bar nor heavy volume was involved. However, a look at the gap show tell tale sign of exhaustion. I feel that the gap is an exhaustion gap. So even if STI not moving up, it has little space to move downward, with the support level @ 2,355.

Since the beginning of this week I was expecting this one more leg down. Since the weekly chart indicated that STI still has some way to go, it has to happen. Now I believe we are not far from the end of this plunge. The long awaited B wave would be setting in. Although both RSI and Stochastic are reversed due to the fall today, they are diverging with the price movement. Therefore I am quite positive now that STI will be going up.

However, this also signifies that the bear is coming. Firstly STI broke its long term trend line. Secondly, all its moving average is above its head, and the shorter MA is going to cross the longer MA soon. If basing on 2/3 reversal, we should see an up trend of 200 points, considering a 300 points free fall.