Google
 
Web thoughts-denzuko1.blogspot.com

My Charting Blog

It is interesting that I start off this Blog when the Singapore Stock Market is heading south. However, this makes it more interesting for me to write on as the market turned volatile. My interest is Technical Analysis, TA for short. I love to look at charts and predicting where they are heading. This blog is or me to record my thoughts on the market. The articles on this blog are based solely on my personal opinion on the charts that I read and readers should not take it as absolute.

4/23/2022

Failure to launch....

While seemingly on decline, I was not having not much concern on Nikkei and Dow Jones. That is until this weekend. Both charts show indications of failure in reaching higher grounds.

Fig 1 Dow Jones weekly chart

During my last up-date, Dow Jones was seen with a long bar resting above moving averages. While the following weeks have shown some signs of weakness, the bars were short and it was not much of a concern. In fact until last week, Dow still stayed above the 55-week moving average mark. However, the bar shown this week changes everything.

To start with We can see that there is an attempt this week for Dow to reach higher, in fact it managed to break the previous high achieved on week of 27th March 2022. If it manages to stay up till the end of the week, it will be more certain that Dow will continue its climb. However, it failed after testing the new high and plunged below the 55-week moving average. 

This is not a good sign for long and it will continue its fall. Its immediate support level is around32,000 and if this cannot hold, 30,901, coinciding with its 144-week moving average.

Fig 2 Nikkei weekly chart

In my last entry on Nikkei, while I was less optimistic on Nikkei, I figured that it is still possible for Nikkei to go higher before continue its down slide. I expected a possible correction before its climb, and the seemingly hammer last week provide a probable indication of Nikkei in continuation up-ward. 

Yet similar to Dow Jones, it tried climbing up but stopped by both 8 and 2-week moving averages.  It closed for the week with a much lower value. We are likely to deal with a down trend continuation. 

The support levels that I am seeing for Nikkei are 25,623 followed by 23,739. 

For some reason, I personally feel that 25,623 is a more viable level. It coincide with the 144-week moving average support. There is a chance that Nikkei to re-bounce upon touching this support level. 

Crossing this point however, is going to be a very different story, we might be seeing a trend reversal on the weekly time frame. 

For the time being, its gradual gradient is still giving me some confidence that we are still on a counter wave. 

Labels: ,

4/20/2022

What's with USDJPY and where is theading?

 With the re-opening of the border, I took the opportunity to drive back to Kuala Lumper last week to visit my parents. 

I don't go home often as I have chosen Singapore as my more permanent home. Eveery time home, I will do my best to spend more time with my folks and bring them around and enjoy some good food. Tour is no longer an option considering their age, even crossing state is a challenge. 

As a result, I am late on my entry.

I did an entry on USD earlier indicating its strengthening aginst other currencies. In my last entry, I did a more detail analysis on EUR and GBP against USD. However, I hesitated on JPY.  Unlike other currencies, USD is on a run away surge against JPY. 

I changed my mind this week. It is still worth checking up on. So what is happening on JPY?

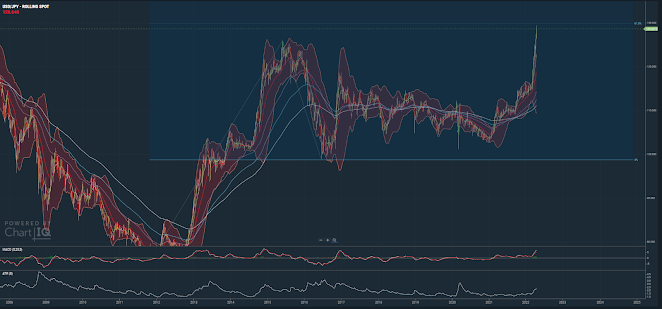
Fig. 1 USDJPYweekly chart 2016 - 2022

Let's first look at the range between 2016 to 2022. It is quite clear here that USDJPY is completing a Zig Zag move, using projection, it crossed its 127% projection mark. However, it thus far have not indication of reversal. 

With its congestion stretching from 2017 to 2020 horizontally, The burst will have to travel a similar stretch vertically. 

Then is there any other indication of resistances in its path?

Fig. 2 USDJPYweekly chart 2012 - 2022

We are now moving further back in time to 2012, It can be seen with a steep ascension prior to its correction by mid 2015. The drop between 2015 to mid 2016 provide a projection measurement. Here we are seeing USDJPY is reaching its 61.8% projection. This resistance level in my experience marks a correction phase after its escalation. The next resistance is 149.302. Is there any support level at this moment? 

I am not very sure as the the moving averages are also at a steep climb, If I am to watch out for would be its 55-weeek moving average. So what else am I seeing on this chart?

Fig. 2 USDJPYweekly chart 2002 - 2022

Moving further back in time to 2002, it is interesting to note the formation of a reverse head and shoulder, What's more alarming? 

It's recent surge has broken the neck line of this formation, meaning a chance for it to reach  176.35! Can this even be possible?

It is a possibility, but it is also possibly be much further in the future. The more pressing objective is to determine the most immediate resistance level. So where should we be setting alarm for JPY?

I can find 2 levels,130and 149.

130 is the 61.8% projection resistance and with such steep climb, there is a chance that a correction is around the corner. 

149 is not only that this is the 100% projection  level, it is also a reversal point in the year of 1998. 

While 149 is quite far away, 130 is likely to be reached either this or next week. It is worthwhile to maintain close observation at this point for one who trade in this currency.

Labels:

4/10/2022

GBP and EUR continue with their downslides

 I can't believe it was November last year that I wrote about EURUSD and GBPUSD. Well, it was March this year that I did mention about these 2 counters, but that chapter was more on USD than EUR and GBP. 

So what is happening to these 2 counters right now? 

Fig 1. GBPUSD and EURUSD weekly chart

In my last entry on GBP, I set a short term target of 1.31 and it is presently crossing the mark. It rebounced from the support level tested the 8-week moving average and continued its down slide. It is suuported by the fact that the 21-week moving average is now crossing the 55-week's. While the moving average of higher time frame (55, 89 and 144) are still in alignment of an up-trend, they are converging downward. The chance of downward movement is still more probable. 

I am wondering if this has to do with Boris Johnson visiting Ukraine, promising lots of funds to support the war? After wall, it is on the last day of trade that GBP broke the previous low, the day Boris Johnson arrived at Kyiv.

My last entry on EUR mentioned that its direction was clearer as the counter has dropped below all moving averages. as I look at it this week, its down slide is more determined.

Firstly, the 89-week moving average made a golden crossed with 144-week, secondly, EUR tested the 8-week moving average and retreated with a long bar moving downward.  It even attempted to cover the gap and failed, further supporting the decision of downward thrust.

With both counters seemingly on a downslide, which one might I want to choose for short trade?
Fig 2 GBPUSD and EURUSD daily chart

Okay, I am speaking hypothetically. I do not really trade in forex, my system is not really suitable for Forex. 

If I am to trade in forex, I will choose EURUSD looking at gradient of their decline on daily basis. The gradient of GBPUSD is gradual and looks as if it is on a counter wave and would bounce up any time. It does not mean that there is a change in trend it might just complete a 3 wave counter wave pattern ending at the 55-day moving average @ 1.326697. If it is to maintain its course downward, its support levels will be 1.290272 and 1.265551.

EURUSD on the other hand has a steeper drop and if correct the next few days might be resisted by the 8-day moving average @ 1.094037. On the down side, it is supported at 2 levels, 1.075807 and 1.049526.


Labels: , , ,

4/03/2022

DAX and FTSC

 Time sure flies, it was only a few days ago I up-dated my observation on Dow Jones, Nikkei and Hang Seng. While seemingly Nikkei an Dow Jones retreated while Hang Seng gained in its position, there is no change in the status of the 3 counters. Reason being that none of them managed to break their resistance or support level.

Fig 1. Hang Seng, Nikkei and Dow Jones weekly chart

looking at the chart, the 8-week moving average is resisting Hang Seng from ascending, while Nikkei is supported by both 21 and 55-week moving averages while Dow Jones by 8 and 21-week moving averages.

While all three counters were into a week's of congestion after a steep ascend,  Both Nikkei and Dow have probability of scaling higher, there are less resistance in that direction. Hang Seng may also ascend higher in the coming week, but I feel that it is likely to re-test the8-week moving average and even the 21-week's.  The resistance is going to be stronger the higher it goes.

The coming week will be interesting for these 3 counters. What about other counters? May be we should look at DAX and FTSC.

Fig2 FTSC and DAX weekly chart

It is interesting thatv I am seeing similar deviation in the direction of these counters. While FTSC managed to bounced above the moving averages, DAX is tested 89-week moving average, failed and retreated, forming a shooting star candle stick. What does it mean to me?

In the first place, DAX actually opened gapped down on week of 27th February. what it seem to be doing is to cover its gap. It is now resisted by both 55 and 89-week moving averages. Is DAX descending from next week onward? Coming week may be interesting. 

DAX has a strong ascension for 2 weeks followed by 2 weeks of congestion with small bodies. While wI see a shooting star potentially meaning a reversal. It is ossible that DAX is undecided at the moment, it may stay within the boundary of 89 and 144-week moving averages in the coming week or more before its next break out. May be this is due to its indecisiveness in its direction on Ukraine-Russia warfare.

While FTSC seems to have less resistance, the general ascension is gradual. I am not sure why. Can it be due to UK having a weaker economy after its exit from Europe? To me, a gradual climb after a steep drop in 2020 makes me feel that it is in a counter wave and it may eventually fall lower after this. Short term wise, it is going higher the next few weeks.