Google
 
Web thoughts-denzuko1.blogspot.com

My Charting Blog

It is interesting that I start off this Blog when the Singapore Stock Market is heading south. However, this makes it more interesting for me to write on as the market turned volatile. My interest is Technical Analysis, TA for short. I love to look at charts and predicting where they are heading. This blog is or me to record my thoughts on the market. The articles on this blog are based solely on my personal opinion on the charts that I read and readers should not take it as absolute.

3/07/2026

USD reversing against EUR and GBP?

 My update on EUR and GBP was quite some time ago in my entry It is tumbling down, but it is not yet for Dow Jones dated 8th September 2024.  This was more than a year.

Since my present series is on currencies began with MYR, I believe it is a good time to check on these 2 counters to look into their health, especially when US is officially entering a war against Iran with Israel.

To some extent, I do not really agree with Trump going to war, this is a marketing part, where he positioned himself as a non-warfare president. In a certain sense, he failed to uphold this narrative.  

At the same time, why should he?

Trump was not rewarded for his earlier action. He was moving towards a peaceful direction, and the result was continuous bully from all sides. 

Nobel simply refused to acknowledge his effort for peace; his attempt to brokerage peace between Ukraine and Russian as humiliated by both sides; Britain and members of European Union abused his attempt to mediate to strengthen their link with Ukraine to continue their pet project against Russia; and Putin mocked him by agreement to cease fire while increasing the intensity of his attack.

It seems like nice guy coming last is true here.

So what good does he get by heading into war?

Americans have been against staging another war for a long time, afterall, US of A has not fare well in warfare since after WWII. They lost in the Korean and Vietnam war, followed by the 2 rounds of Iraq wars that drained a lot of their resources, not to mention the war of Afghanistan that ended with an embarrassed withdrawal of the US troop. 

The people of USA are tired of losing.  

First off, US operation in Venezuela shocked the world, not because of the so call "invasion", but how powerful and precise the US military might be. They entered a country's capital that was fully fortified, captured the president and have him shipped back to USA for trial.

This does not earn him respect, but induced fear into all the Central America countries that has been defying USA for close to a decade. All these countries intentionally opposed USA while enjoying the goods of US wealth. the operation in Venezuela is a wakeup call to all of them, making them realize that US has the power to disable them and chose not to all these times. Now even Cuba is seeking peace talk with US, something that had not happened since JFK.

The most important thing here is that he helps USA to regain its pride. This is what he promised the people of USA, they will have so much winning until they cannot take it anymore.

The attack on Iran on the other hand is to give the United Nation, Russia and China the middle finger, and demonstrating how far behind are the number 2 and 3 in military power against US. As such Trump has to win this war against Iran, the key word is 'fast', the longer it drags on, the lower the support from home it will be.. Not only that he has to make sure that he can succeed when all his predecessors failed, which is the rebuilding process.

Europe and Britain reacted differently on this Iran war. Europe chose to support Trump since the war started (with exception of Spain), Britain led by Keir Starmer on the other hand, decided to have a weak spine and tried to chicken out, being called out by Trump. 

Anyway, enough of my rant. I am supposed to just look at EUR and GBP. What I see on both GBP and EUR are similar.


Fig 1. EURUSD weekly chart

EURUSD peaked on 25th January 2026 with a high of 1.20827. At the same time a shooting star was formed. It was on a retreat since then, resisted by its 100% (1.19187) of its major projection.

It however, was not decisive in this direction, reason? Overlapping bars and a lack of momentum. It is also support by its 100% (1.16332) to 127% (1.15164) projection on its decline. Further to that, it is also coming close to its 55-week moving average of 1.153020. This also coincide with its 127% projection of 1.15099.

While with sign of divergence from MACD, it is yet to show confirmation. 

There may still be a chance that EUR to climb back up one more time before a true reversal to come true. It may crawl back to test its 100% projection again. If it manages to breakthrough, its next level of resistance will be its 127% projection of 1.23923.


Fig 2. GBPUSD weekly chart

Similarly, GBPUSD reversed on25th January 2026 with a shooting star. difference here is the overlapping of the bars is more consistent. Like EURUSD, there is also divergence on its MACD.

Difference from EURUSD is that it managed to reach its 55-week moving average of, further to that, a hammer is formed while supported by this moving average of 1.33080 as well as its 61.8% projection of 1.33896. It is possible that GBPSD will reverse up in the coming week. However, it requires bar confirmation, as this in conflict with its MACD behavior that tends to cross downward.

If it is to trend downward, I will see a much stronger support at its Bollinger envelop of 1.31033. On continuation upward, its next level of resistance will be the other envelop of 1.37993, which coincide with the 61.8% of a major projection of 1.37840.

In conclusion, there is a tendency for USD to strengthen against both EUR and GBP, but not just yet. With USA and Israel, the only ones into the war, they are the one spending money, it will also mean a weakening of USD during this period, if USA is to be dragged in a much longer period of time, it will really lead to USD to further deteriorate against ALL other currencies.


Labels: , , ,

9/08/2024

It is tumbling down, but it is not yet for Dow Jones

I remember it was a day of tumble on Dow Jones, leading to a group of anti-Biden-Harris using it to determine that US market is collapsing and that it is due to Harris' proposal. 

That was a month ago that happened to be Singapore's national day. I wanted to complete the Singapore's read first before continuing with proceeding to checking on the US market. After all, it was only a single week of downturn and insufficient for me to determine a reversal.

unfortunately, what followed led to further delay in my entries.

First off, my wife's family gathering used up one of my week. Then a gout attack on the second weekend caused me to take some pain killers, but the wrong prescription from the pharmacy caused me to take anti-depressant instead.

At least I know now that it did not make my less depressed, but instead I was attacked by continuous drowsiness and slept throughout the weekend with no improvement on my swelling and pain.

Then I had a week's off going back to KL, focusing on my mum's needs.

Finally, this week, I get to sit down and work on this entry.

I have been following the US political arena and if you are observant enough, you will notice that US is on deterioration as a country. It is very deep in debt while the politicians lack the will power to bite the bullet and move towards austerity. 

They attempt to distract the people into focusing on personal gain, ignoring the more pressing issue what the country is heading into the abyss of down fall. 

Having said that, I believe it is not yet time for US to collapse. There is a Chinese saying that 'even a rotting ship contain 3 portion of iron nails'. There are sufficient talents and resources in US for it to stay afloat, if they play their cards right.


Fig 1. DJIA weekly chart

Since the tumble a month ago, Dow Jones actually reached a new high after its fall stopped by the 21-wek moving average, only to 'tumble' again this week. Strange that there is no comment from anyone this time. Is it because the event does not match the narrative?

Ok, let's stay objective in looking at Dow Jones chart. 

The Dow just reversed from a major 100% projection, crossing and stayed below its 8-week moving average. The gradient of ascend remained gradual, indicating a weak momentum. The potential of a downward movement is increasing. 

On the other hand, it has not produced any reversal candle stick. Neither has MACD shown any divergence, indicating that there might be some upside. 

I suspect it may still be another correction with the next support at the 55-week moving average of 38,060, which is mildly above the Bollinger envelop of 37,824. If this happens, it crosses a crucial point of 38,390, which become a neckline for double top base on the present set up, this will lead to a new objective of between 35,389 to 36,708.

On the upside, its immediate resistance is between 41,773 to 42,2185.

For the time being, I do not see that Dow Jones is crashing, at least not yet. However, the same can't be said for its currency.

Let's look at JPY first.

Fig 2. JPY weekly chart

My last entry on JPY was The curious case of JPY-Nikkei divergence, I noted JPY strengthening against USD, with downward potential of 143.141.  As of today, it crosses this level reaching a low of 141.6770. It corrected after the support from Bollinger envelop, it continued its decline but more gradual with present low still above the earlier level. 

Based on the present set up, I do not have upward measurement as there is still no reversal nor divergence indication. So, I will assume continuation downward with further strengthening of the currency against USD.

The next support level is between 129.176 to136.906.

If I am to set an up-side resistance, it will be the 55-week moving average of 149.2248.

Guess I should be seeing more downside on Nikkei since it always move in the opposite direction to JPY.
Fig 3. EURUSD weekly chart

My last entry on both EUR and GBP is Divergence between GBP and EUR dated 3rd Sept 2023. That was more that a year ago. I suspected at the time that EUR and GBP might part their ways. They did not, both continued to weaken against USD for a short while before reversing back up.

I see from the latest chart that EUR is correcting after crossing its 61.8% projection resistance now turning support. It remains above this level of 1.10258. I believe that it should further strengthen against USD with next resistance level between 1.12922 to 1.14787.

One point to note here is the previous high of 1.2759, this coincides with the 61.8% retracement level which is also very close to the 100% projection resistance.  I suspect it may be difficult for EUR to break this point. 
Fig 4. GBPUSD weekly chart

GBP actually fair batter than EUR, it crosses its previous high of 1.31425. It presently retracted from its 100% projection point in what seemingly a congestion at this point. It may hit higher after this.

The next resistance for GBP should be 1.33897 to 1.37742.

One point to note is the gradual gradient of the uptrend for these 2 counters. I suspect while both currencies strengthen against USD, they may be negotiating a top formation. But I think it may take some time before reversing downward.

In conclusion, it is not Dow Jones that is going down, but USD certainly shows much weakness at this point of time. The most important asset of USA is its currency that is used in all international trade. But generations of US politicians take it for granted and print USD as a quick fix for all their problem. Its debt is in level of Trillions, an amount unseen in history. If USD breaks, it signifies the collapse of USA.  

Labels: , , , ,

9/03/2023

Divergence between GBP and EUR

I have meant to include an entry last week. However, I really ponder on what I should discuss. 

There are a lot of callings about China's deteriorating economy. Many also calling out Disney is doomed due to DEI. We also have Malaysia just past its state election. 

I was looking at all the charts and honestly, I did not feel like starting any discussion on these.

I relook at the charts this week, and finally decided to enter a piece on EUR and GBP. My last entry on these 2 counters was EUR GBP Comparison dated 6th of May 2023. I felt that it is about time to check on their progress.


Fig 1. EUR weekly chart

In my earlier update, EUR was crossing the moving averages, and I estimated a further climb upward, strengthening against USD.

However, it continues to struggle against the 144-week moving average since then. Every new high was quickly followed by a retreat, violating the previous high. 

At the same time, the major moving averages (55, 89 and 144 weekly moving averages) maintain a bearish indication.

These are not good signs for EUR, especially a divergence indication from the MACD with lower highs and lows for every new high and low on the chart.

While it is not ready for a firm estimation of support pending more signal certainty. A rough estimate should this be the highest it can go, would be between 0.8461 to 0.9538.

What of GBP?


Fig 2. GBP weekly chart

Surprisingly GBP seems to be more resilient against USD, it continues to strengthen against USD. It in fact reached the 61.8% projection before retreating.

Considering 61.8% projection to be resistance for a correction, at the same time there is no divergence on MACD part.

I suspect it is going to hit a new high after this correction.

The only concern is the structure of the major moving averages (55, 89 and 144 week moving averages) maintain a bearish tendency.  There may still be a chance that it will head on with a bearish continuation if it breaks 1.2470.

If both cases are true, GBP and EUR may be parting ways.


Labels: ,

4/09/2023

Currencies April 2023 update

Time passes very quickly, it seemed that we just celebrated new year, then Chinese New Year, the passing of my father and now we are into the second quarter of the year. May be I am getting much older now?

anyway, I have recently rekindled an old hobby of mine, I am now back into comic drawing. Drawing has been an important part of my life since I got to know the world. My first drawings were on the wall in my grandmother's room, a fish, or part of it. 

My uncles were in school at the time, and they were studying Biology, I managed a glance of the human organs in particular the digestive system. I drew a fish with the human digestive system as a result.

It was through years of work life that I started to lose my ability in drawing, the longer I was in the work force, the less imagination I have. So much so that I held a pencil in mt hand, a piece of paper in front of me, and it went blank for hours.

My flame in drawing grew recently when I found interest in perfecting my sketches of the female anatomy. Yes, I love drawing female, why? I remember one artist said when he was asked the question," because I love women."

anyway, at this point of time, it is not about women, or my sketches. Let's check on the sketchings of the charts.

I have recently heard from a youtuber that the US politicians were focusing on the wrong thing such as woke culture and "inclusivity" when the true problem is the decline of the USD.

The USD decline was mentioned often. However, It is recently facing more threat than before, with news that the Saudi and China going to trade oil using CNY, and that China's influence growing stronger to the extend that it initiated a peace talk between Saudi and Iran. Further more, an increasing number of countries are joining BRICS, a coalition to counter the strength of USD.

 I did an up-date on USD in April 2023 titled Currencies March 2023 update, While there were signs of upward reversal, I was uncertain on a few pairings. A month has past now, how is the USD doing right now?

Fig 1. SGD weekly chart

SGD did not go into correction. 

At this point of time, it failed to break through the 21-week moving average. Moreover, the point which it reversed coincided with the 61.8% projection level support of a major move. I figure that it will head towards its next level of support (100% projection). 

While hesitating at this moment, it nevertheless resisted by the 8-week moving average, it is indicative that USD will slide lower against SGD. 

During its last low, the counter did not touch its 100% projection support before its debounce, I suspect it will not stop at 100% mark and move further towards its 127% projection support at 1.26.

The correction upward has also generated another projection measurement. Its 61.8% projection support coincidentally is near the 127% projection level at 1.2679.


Fig 2. JPY weekly chart

Similar to SGD, JPY has also fell of after its correction upward. It is presently supported by its 55-week moving average. However, it also seems to lack inertia to reverse upward, giving me a feeling that it is congesting for a flag formation. 

It is however, floating above the 55-week moving average, which coincidentally at its 38.2% retracement support.

I am still uncertain of its trend at the moment. So I head back to a bigger picture.

As long as there is no violation of its formation, I will still consider its trend to head downward with support at between 113.220 to 122.59. If it is heading up, it will face its Bollinger resistance at 140.28

Fig 3. EURUSD weekly chart

I am using the chart on my trading platform as it has more Fibonacci tools than finance.yahoo.com. However, it only provides EURUSD pair and not the other way round.

EURUSD is presently retesting its previous high, coincidentally meeting the 144-week moving average resistance. It has not yet violated the old high.

For the time being, the formation gives me 2 possibilities: Support of between 0.8224 to 0.9308; Resistance of between 1.1436 to 1.2022.


Fig 4. GBPUSD weekly chart

Unlike EURUSD, GBPUSD chart looks rougher, probably because of BREXT and its present political turmoil. Of the 2, GBP seems weaker than EUR.

The general trend of GBP is down against USD, even with the recent up-surge, the present measurement unable to see it breach the previous high of 1.4242, with resistance between 1.3104 to 1.3903.

On the downside, there are 2 sets of measurements, a more recent one with up to 127% projection support of 1.04967, which has been tested before reversing up. The other with support between 1.190 (which has been crossed) and 0.9223. 

Some time it is sad to see such powerful nation goes into deterioration simply because self centered politicians who are good in speech yet incompetence in running the country. They ride on the band wagon of woke culture not because they believe in its cause, but it guarantees their own political survival. 

Going through world history, it is not difficult to see that an empire is reaching its death bed when the focus of the government is not focusing on the big issue to bring the country to the next level, but to focus on insignificant issues that do not even affect the country progress in any way. 

When the west is focus on avoiding hurting feelings of a certain people, they will lock themselves in a shell and shrink while other grow. 


Labels: , , , , ,

3/05/2023

Currencies March 2023 update

It was February 4th that I did an update on currencies titled Is USD on free fall? USD was seemingly at on a free fall the time. However, I also ignored the fact that the currency pairs were all in process of crossing the moving average belt, making it tougher for the counters to cross through.

In fact, the moving average belt seems to reverse the trend for USD.

Fig SGD weekly chart

In my last update, it was noted that SGD was close to its 100% projection support. Reversal happened since then. The upthrust of SGD is as strong as its downslide earlier, with similar steepness in the opposite direction.

Are we seeing USD strengthening against SGD? 

It might still be too early to tell. At the end of this week, its ascension is blocked by the 21-week moving average, producing a hang man candle stick. While so, the pattern does not look spectacular.

Another interesting thing on the chart is the MACD which has just crossed from the bottom. It is possible to be an indication of reversal. 

My suspicion is that it might go into a correction after this.

Fig 2. JPY weekly chart

Similarity is observed on JPY, except that JPY has broken through and stayed above the moving averages. There is a higher chance that USD will continue to strengthen against JPY from here on.

JPY is presently resisted by its 38.2% retracement line at 136.68. If broken, the next level is its 61.8% retracement at 142.58.

A point to note is the crossing of MACD, a similar situation to SGD.
  
Fig 3. EUR weekly chart

EUR is weaker than JPY, going against USD. It is presently stopped by its 21-week moving average. Nevertheless, it is presently on borderline support of 55-week moving average. 

Like both JPY and SGD, its MACD has also crossed from the bottom. It is more likely that the direction is still up for the time being.

Using retracement, the likely resistance level lies between 0.9611 to 0.9944.
Fig 4. GBP weekly chart


GBP is more interesting here. It seems to be in a rectangle formation. Unlike EUR, it did not break to a lower low, and reversed on reaching the previous low. As such there are 2 possibilities. 

If it breaks the upper boundary, then we are seeing an objective of 0.8848. If breaking the lower boundary on the other hand, the objective will be 0.7623.


Labels: , , ,

2/04/2023

Is USD on free fall?

After my last entry Why oil price went up?, I noted USD weakening against SGD, it made me wonder how it is performing against other currencies.

Fig 1. JPY weekly chart

How shall I say this?

Compare to JPY, USD seems to be on a free fall. This is a spike reversal although the the peak bar did not exhibit a single bar (or shooting star candlestick) or 2-bar reversal.

While it fell through 55-week moving average in January 2023 and remained below till now, it nevertheless seems to be losing momentum.

I feel that it is possible that a correction might be in range. However, its 8-week moving average is in process of crossing the 55-week's, we might need to wait a little longer, probably until the 21-week reaching 55-week moving average.

I do not really have any projection read for the time being. So based on the retracement measurement, support level is at about 120.76 to 126.96.


Fig 2. EUR weekly chart

Similar to JPY, USD is also on an apparent free fall against EUR. However, there are more pauses for EUR, making it looks like EUR is with a 5-wave down.

The 8-week moving average has already crossed 55-week's and it is about to reach 89-week's. EUR even crossed the 144-week moving average this week and closed below it. It will be interesting to see if 144-week moving average can continue to resist the counter from going back up.

Using projection, the next support levels are between 0.8584 to 0.8948. At the same time, EUR is about to reach its 61.8% retracement support at 0.9005.


Fig 3. GBP weekly chart

Just looking at the chart, do I need to say more about GBP?

Yes, there is something to say. GBP seems to be the weakest of the 3 currencies. While the other 2 breaking the 55-week moving average, GBP was actually first supported by its 55-week moving average before breaking through the second time. 

In fact, the moving averages support for GBP is stronger than that of EUR. As such, can I say that Europe's economy is presently stronger than UK and that the UK market is less attractive to the investers?

Using projection measurement, I can see support at between 0.7522 to 0.7874, coincidentally its 144-week moving average position at the moment.

GBP is again congestion after crossing the 55-week moving average. Making a potential set up for another projection measurement. However, the set-up is incomplete, so I won't be doing the measurement for this just yet.

In my last up-date on USD in Federal reserve considering slowing down of rate rise...., I have estimated USD would continue to weaken against other currencies. Looking back that entry, the few counters here is either near or have reached the objectives set. 

I am not boasting about my skill set here as there is little skill set needed to set up measurement based on Fibonacci retracement and projection. I am concerned. 

USD is actually on some kind of free fall after reaching its peak. If I am to use a metaphore on this, I can only bring in the Super Nova, the final burst of a dying star. It is possible that people are dumping USD! Considering the recklessness of the US politicians taking for granted the world dependency on its currency. I believe that they have not even noticed potential danger ahead of them. 

That this point of time, they are still thinking of rising the debt ceiling and taking the easy way out instead of cutting spending. What will happen should USD reach the next level or even lower?

Devaluation of USD can lead to inflation or even hyper-inflation. By then USA will be heading for hardship, worst still, it is bring the world along.


Labels: , ,

11/27/2022

Federal reserve considering slowing down of rate rise....


(Click photo for news link)

I have an entry last week about the possible weakening of USD titled Is USD weakening now? on 23rd November 2022, I only used SGD for comparison, partially because I stay in Singapore. The other was because I was a little tired, I have just travelled back from Malaysia, and I have not fully rejuvenated yet.

USD was at a crucial point of uncertainty as it reached a triple moving averages support level, making it difficult for USD to continue its downslide against SGD. Never-the-less, I placed my bet on eventual continuation due to its present set up, especially when it was resisted by the 55-week moving average.

On 24th of November 2022, news came out that there is a consensus to reduce the rate hike. By this time, USD has fallen quite a while. I noted the beginning of a fall in Interesting development in SGD...and I missed the entry point on SGDMYR on 6th Oct 2022 but at the time, I was uncertain. It was only on further development that I became more certain by 16th October 2022 in Monetary intervention on SGD and a case for the currency

EEnough about SGD, how are other currencies performing against USD?
Fig 1. Jpy weekly chart

Let's start off with JPY. The market was till panicking with JPY a while ago considering its steep fall against the USD. Apparently, the reversal came on 16th October 2022. It has so far tested 21-week moving average and now resisted by this moving average, it is possible that JPY will continue its journey to the next support level of 55-week moving average.

Using projection on this pause, I obtain a measurement of support between 131.199 to 135.41. Coincidentally it is close to where 55-week moving average presently lies, 131.24.  It is also close to the previous bottom of 130.41.

It is possible for me to use the top as one of the references, however, I will use a single sub-wave 3 for measurement. The chance of this objective reached is higher.

Fig 2 EUR weekly chart

EUR behaves in a similar way as that of JPY, except that it started a few weeks earlier than JPY on 25th September 2022. However, it is presently floating between 21 and 55-week moving averages.  

Same as JPY, I will use sub-wave 3 to be used for measurement. However, as it is afloat, it is possible that EUR might move towards 21-week moving average before going down further. 

Adopting projection, I obtain support between 0.9048 to 0.9327.  This range is coincidental with the 89 and 144-week moving average. However, it is my belief that 55-week moving average is prudent in many cases, as such I consider an additional support at 0.9506 for EUR decent.
Fig 3. GBP weekly chart

I did an entry on GBP in GBP s looking good..... earlier but I compared it to EUR. Comparing it with USD, let me feel that DBP is more aggressive than others. While JPY and EUR are pausing after a plunge, GBP has already broken through its congestive stage and on continuation downward. It is close to reaching the 55-week moving average as week speak.

Using projection, GBP has past its 61.8% projection support at 0.8315 and the next support level is 0.7917, by when reaching its 89-week moving average as well as its Bollinger band lower envelop. The possible support addition to these is the 55-week moving average of 0.8147.

So far we are seeing USD weakening against the few major international currencies. How is HKD doing then?
Fig 4. HKD weekly chart
Evience of HKD strengthening against USD only visible on 6th November 2022. This is due to HKD ceiling against USD preventing it from its natural development. I won't do much measurement until more development on this counter. As far as I am concern, it is only stopped  50% retracement, and by the end of the week stayed above the 144-week moving average.  

Gapping during the last 3 weeks of descent further demonstrate potential for further down slide. The only problem is that the weeks end with much recovery, indicating uncertainty in its descent. The moving averages also indicate that it may not be ready to go down just as yet. I suspect that there might be a correction on the way. 
Fig 5. CNY weekly chart

While HKD descended from brink of its limit, CNY has not, it was allowed to develop its pattern. 

The reversal of CNY came after 30th October 2022, much later than GBP and EUR. it has only broken through its 8-week moving average 2 weeks ago and stayed below this support turned resistance by the end of this week. 

However, I am pretty uncertain about this counter. while it is seemingly on a down trend, its bars are all positive. The counter can go either way.

At this moment, there are much uncertainty in this counter that I will refrain from establishing measurement. I will do this later. 


Labels: , , , ,

9/14/2022

The sudden plunge of indices last night and present status of currencies

 I was lazing at my station last night with the Dow Jones Chart turned on. I remember it was around 8:00PM plus (Singapore time). I was watching some video on Youtube.com when all the sudden I noticed a sudden plunge on Dow Jones 3-minute chart, it was exactly 8:30PM. 

I was taken aback with the sharp descend. While I faithfully follow the principle of technical analysis which discount any fundamentals, I can't help but to think, " what happened?"  

I quickly check on other indices and I found similar situation even on Nikkei and Hang Seng. I even checked on the German index DAX and the same thing happened, there must be an event that shook the market.


Fig 1. Nikkei225, Hang Seng and Dow Jones 3-minute chart

Turn out there is a Fed report that while the rate was raised, inflation in August was above expectation at 8.3%, rose by 0.1% compared to previous month.

Anyway, as I have said, I was lazing. I was too tired to do anything about it, Furthermore, this may lead to congestion, and I was not really keen on Dow Jones as it means mid night trading for me.

As for today, my main intention is on currencies as there has been much hype about weakening currencies. Already many experts have been telling people that it is not the weakening of the currencies of their countries, it is the strengthening of USD. This was also what I mentioned in What is USD doing?

I will focus on 3 currencies today to determine where they go: JPY, EUR and GBP. Even though technical analysis supposed to enable quick analysis, it does take time to analyze each chart.

Let's start with JPY since there is so much warning from youtube.com videos that JPY is very weak against USD even though it is known as a safe haven currency. 


Fig 2. JPY weekly chart

Based on my interpretation, there are 2 zig zag patterns and, in a way, form a double bottom, so there are 3 measurements. In the long run (blue zig zag), it has already crossed the 61.8% projection at 136 and heading to 146. 

we can ignore the other zig zag as well as the double bottom. The objectives were much lower and surpass.  

Breaking146, the next level of resistance is 159. Will it go further than that? Possible, but let's focus on the more immediate ones first.

Let's move on to EUR.


Fig 3. EUR weekly chart

Interesting enough, there are also 2 zig zags and one double bottom (more like a triangle). 

With the longer-term zig zag (in blue), it has already past the 61.8% projection at 0.9505, the next level of resistance is the 100% projection at 1.046 and 127% projection at 1.114.

 As for the double bottom (or triangle), the resistance is even further at 1.082.

As for the smaller zig zag (in green), the next level off resistance is 161.8% projection at 1.041.

So 1.04+ is really one level to watch out for.

Finally, let's move on to the last currency of this entry, GBP.


Fig 3. GBP weekly chart

Unlike the other 2, GBP lacks the formation of double bottom (or triangle). There are only 2 zig zags that I can measure with projection.

Using the longer-term zig zag (in blue), the 100% projection resistance at 0.948 while 127% at 1.0165.

The more immediate set up on the other hand, resistance at 100% projection is 0.877 while 127% at 0.9246.

While the oil price is kind of stabilized in US, it is because of a stronger USD. For other countries however, we will continue to see higher prices on oil, unfortunately.


Labels: , , , , ,

4/10/2022

GBP and EUR continue with their downslides

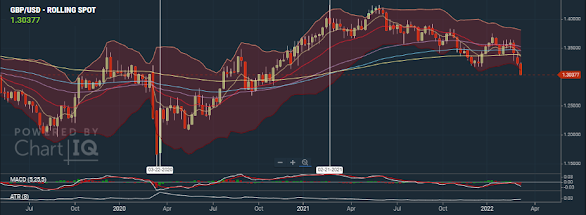
 I can't believe it was November last year that I wrote about EURUSD and GBPUSD. Well, it was March this year that I did mention about these 2 counters, but that chapter was more on USD than EUR and GBP. 

So what is happening to these 2 counters right now? 

Fig 1. GBPUSD and EURUSD weekly chart

In my last entry on GBP, I set a short term target of 1.31 and it is presently crossing the mark. It rebounced from the support level tested the 8-week moving average and continued its down slide. It is suuported by the fact that the 21-week moving average is now crossing the 55-week's. While the moving average of higher time frame (55, 89 and 144) are still in alignment of an up-trend, they are converging downward. The chance of downward movement is still more probable. 

I am wondering if this has to do with Boris Johnson visiting Ukraine, promising lots of funds to support the war? After wall, it is on the last day of trade that GBP broke the previous low, the day Boris Johnson arrived at Kyiv.

My last entry on EUR mentioned that its direction was clearer as the counter has dropped below all moving averages. as I look at it this week, its down slide is more determined.

Firstly, the 89-week moving average made a golden crossed with 144-week, secondly, EUR tested the 8-week moving average and retreated with a long bar moving downward.  It even attempted to cover the gap and failed, further supporting the decision of downward thrust.

With both counters seemingly on a downslide, which one might I want to choose for short trade?
Fig 2 GBPUSD and EURUSD daily chart

Okay, I am speaking hypothetically. I do not really trade in forex, my system is not really suitable for Forex. 

If I am to trade in forex, I will choose EURUSD looking at gradient of their decline on daily basis. The gradient of GBPUSD is gradual and looks as if it is on a counter wave and would bounce up any time. It does not mean that there is a change in trend it might just complete a 3 wave counter wave pattern ending at the 55-day moving average @ 1.326697. If it is to maintain its course downward, its support levels will be 1.290272 and 1.265551.

EURUSD on the other hand has a steeper drop and if correct the next few days might be resisted by the 8-day moving average @ 1.094037. On the down side, it is supported at 2 levels, 1.075807 and 1.049526.


Labels: , , ,

3/13/2022

What is USD doing?

 While the war between Ukraine and Russia is on-going this week, there as been little change so far on the direction of the few indices that I was focusing on, they are still on the way down. 

This made me wonder how the currencies are doing right now, in particular SGD?

Fig 1 GBPUSD weekly chart
Fig 2 EURUSD weekly chart
Fig 3 USDJPY weekly chart
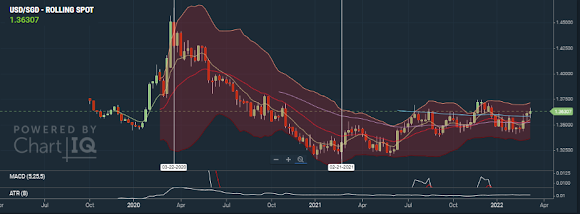
Fig 4 USDSGD weekly chart

Not that I am spending a lot of time and effort in analyzing individual charts, I observed one common behavior from these charts.

USD is getting stronger. This can be seen from both EUR and GBP weakening against USD while USD strengthening itself against JPY and SGD. Imagine that! After printing so much money USD actually become stronger?

It is also interesting to note that USD strengthening itself against both Asian currencies  since 3rd January 2021 while it was not until 21st Febuary 2021 that the 2 European currencies weakening against USD. Yes, it is 2021 and not 2022, it is not the Ukraine-Russia warfare that cause this. 

The strengthening of USD against EUR and JPY is more serious than GBP and SGD, Its rise against GBP and SGD is more gradual, both are either breaking through or just broken and retested the moving averages.. EUR and JPY on the other hand have their trend set since last year (March 2021 for JPY and Oct 2021 for EUR).

Among the currencies, is there any that are strong against USD?

Fig 5 AUD andd NZD weekly chart

I am placing these 2 charts side by side because they look like twins. Both counters actually weakened against USD at the same time as EUR and GBP , on 21st February 2021. However, both descents stopped on the week of 30st January 2022 and has been climbing since then. 

They are both testing multiple moving averages at  this point of time. From the looks of it, it is possible that they ill continue to rise against USD in the near future. What cause me o conclude as such?

I am looking at the behavior of its higher time frame moving averages, they do not seem to be interested in crossing while converging on each other. So even if they cross, it is likely that the crosses are weak. Further more, there seems to have more momentum for these 2  chaps to move further up.

Nevertheless, we might see both counters to draw back a little before moving forward.


Labels: , , , , ,

11/28/2021

How is EUUSD compare with GBPUSD?

 After going through GBPUSD, I am curious to know how EURUSD is doing, after all this is the other forex counter that I took interest in.


 EURUSD weekly chart

Unlike GBPUSD, EURUSD is clearer in its direction, not only that it broke away from the moving averages, it even reached the 61.8% retracement and projection support. It is also clear that EURUSD has broke out of a double top with target of 1.10630.

Now it makes me wonder, Is the European Union doing worse than Great Britain? 

Anyway, it is more interesting to discuss what might come next for EURUSD. 

A hammer is formed at the support level. Is this a sign of reversal? While a potential sign of reversal, it is small to indicate a significant relevance. Further more, there is a strong momentum downward prior to this reversal. 

The chance is a correction before EURUSD continue its down trend. The coming week's bar is important. A strong momentum upward will indicate a reversal while a short bar with possible overlap can indicate a small congestion. The worst case would be a long a slow climb back up until it is resisted by the descending 55-week moving average.

For the time being, I will still consider EURUSD be on a down trend with possible limited down side. I will need to wait for a correction to complete before trading down.


Labels: , ,