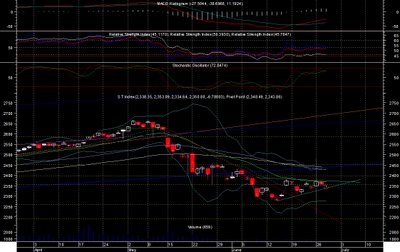
 Fig 1. STI Daily Chart
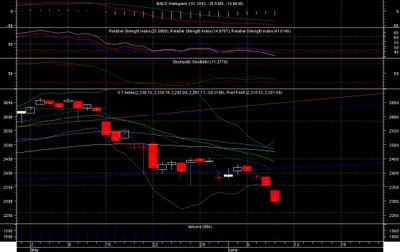
 Fig 2. STI Weekly chart
I have to apologise to the forumer where I borrow this title without asking. Hope that he won't sue me for copy right. Up to now we have already experienced 5 weeks of sell down, started on the week right after the Singapore Election. There are now a lot of mix signals in the forum on whether we have actually hit bottom for this round. Many as I have seen are quite delusioned about prospect of an up trend although there are still a few who is getting more bullish, with me as one of them.
I was disappointed with the week's performance as I have predicted a reversal during the week. It never came. However, as I can understand from my experience is to repect and fear the market. You can play with your system but never play with the market, some thing that you will never win.
So pride swallowed, I move on. I stopped loss on one of the only 2 stocks that I am holding at the moment, Tiong Woon which has broken its support at SGD0.25. Some forumers were puzzled of my action as they are seeing the stock is at historical low. I see it differently, 0.25 has been supporting this stock for 2 weeks showing that it is a strong support point. Breaking downwards means risk of further down slide. I normally put my stop loss at support/resistance area, so once broken it is some time difficult to catch the stop loss level. would I be wrong about Tiong Woon? I might, there were times when a stock that I have dumped shot right back up, there were more times when it went further down. So I would rather be safe than sorry for this.
With this side line settled, are we at the bottom yet? Its not easy to say still. In general I believe that we will be on continuation downwards after an up trend that do not exceed 2500 so to complete the A, B and C wave. I am a little unsure of the completion of A wave as my calculation varies depending on which point I use for the top of wave iv. If it is 2,459, I see 2,279. If it is 2,430, I will get 2,252.
The indicators on the week chart are also not very encouraging, RSI seems to have reached the bottom but fall short of a reversal, Stochastic is at the bottom and on a verge of crossing up ward. Both of them still need the coming week to confirm their directions.
The Daily chart is more interesting, both RSI and Stochastic has again turned upwards. They did so a few times during the past few weeks. but the difference with this week is that by Friday, the chart is forming a potential Harami pattern, upwards. Confirmation is needed on Monday to determine that this is true. Further more volume is stronger this round. Now if these few factors are available by Monday, including higher highs and lows with higher volume, it will be very possible that we are seeing a B wave upward.
So fingers have to be crossed on Monday. However, it is unfortunate that I will be oversea this week for courses. I will not be able to monitor the stocks and index properly until Thursday evening*sigh*. Anyway, the support and resistance levels are still at these areas 2,279, 2,355, 2,398, 2,451.


 The Nikei 225 has done a reverse head and shoulders but forgot to touch the trend line before moving on. Now it is coming back to complete the job. Divergence is seen on both RSI and Stochastic, therefore supporting its down turn. However, I suspect that its fall will be stopped by 14,557.
