Google
 
Web thoughts-denzuko1.blogspot.com

My Charting Blog

It is interesting that I start off this Blog when the Singapore Stock Market is heading south. However, this makes it more interesting for me to write on as the market turned volatile. My interest is Technical Analysis, TA for short. I love to look at charts and predicting where they are heading. This blog is or me to record my thoughts on the market. The articles on this blog are based solely on my personal opinion on the charts that I read and readers should not take it as absolute.

3/28/2022

Who are staying afloat and who is struggling?

 I committed myself to a weekly up-date on my blog, yet I failed to do so during the weekend. 2 things happened. 

My family went for a picnic during the weekend, and this time we prepared Japanese bento with rice onigiri. The process is a little long but the result worth the effort. 

The other event was the Singapore trading festival. This event happens during 2 weekends, conducted oonline. The first 2 days started last Saturday. I was a little disappointed with the event, most of the programs involved introducing REITs and stock sectors, less on other markets such as commodities, futures, etc. Further more, there is only one session involving technical analysis which is the main part of my interest.

There are 2 more days to this event happening the coming weekend, if anyone is interested, the link is Singapore Trading Festival (sgtradingfestival.com).

I have made an entry concerning 3 indices 2 weekends ago, so what happened during the week? We managed to stay afloat and who is still struggling? 

Fig 1. Dow Jones weekly chart

we first look at Dow Jones, it landed in a tight band last week after a strong  surge. The good thing is it ending above the 21-week moving average. 

While the 8-week moving average is below 21-week, it is more significant with the closing stays above 21-week moving average. 

Another interesting observation is the higher ranking moving averages, 55-week above 89-week above 144-week. This seems to be supporting an up-trend.

There is a chance that Dow Jones might test the down side this week but there is enough support to stop it from a plunge, it might end with another week of short bar before moving higher. 

Fig 2. Nikkei weekly chart

Comparatively speaking, the performance of Nikkei is muc better than Dow Jones, maintaining a strong surge on the second week, staying above the all the moving averages.

The worrying part of Nikkei is having both 8 and 21-week moving averages below 55-week, therefore this week's performance of Nikkei is significant to decide its fate. Still I feel that there are multiple levels of support to avoid its downslide. We might end with a short bar this week for Nikkei before moving higher.

Fig 3. Hang Seng weekly chart

While Hang Seng has the strongest surge earlier, I was not really feeling good about this index.  It failed to penetrate any moving average. 

So what happened last week?

Not only that it failed to penetrate 8-week moving average, it closed lower. Further more, the 3 higher moving averages (55, 89 and 144-week) are resisting its climb.  

I expect Hang Seng to retest the 8-week moving average this week but it is struggling. 

Carrie Lam might have sense something is wrong with the market, she is nevertheless a little late to do much, plus, she and her team is incompetent and really only good in pleasing their master in the north. I am doubtful that they can come out with any policies that can stop the descend.

3/20/2022

Reversing or dead cat bounce?

Even as a chartist, I have to admit that the Ukraine-Russia war was the main influence to the strong surge in the indices that I am monitoring. While having such strong rebounce, I can't help but to wonder if it is enough to determine a change in the trend of these indices.

Fig 1. Dow Jones weekly chart

To be frank, Dow Jones is the index least affected by this war event. In fact it has shown a reversal with a hammer and closed above the 55-week moving average by the end of the week. Even when it continued to descend in the 2 weeks following the war, it never-the-less did not violate the low of the hammer,  supported by the 89-week moving average, coinciding with the 23.6% retracement.  

What's interesting is that the surge this week broke through all the moving averages resisting it.

There is a high tendency that Dow will continue to ascend further. My feel is that Dow might congest at the 21-week moving average for the next one or few weeks before continuing on its way.

Fig 2. Nikkei weekly chart

While the surge is strong in Nikkei, it did not manage to penetrate through all the moving averages, especially the 55-week moving average that is also seems to be turning downward.

Further to that, I can also see a double top formation on Nikkei, which the neckline has been crossed. This week's surge is testing this neck line. So far it is staying above the neck line, coincidentally also the 89-week moving average. However, I normally pplace 55-week moving average a more important  factor for consideration.

The one thing that is unsettling to me is that the gradient of its descend is gradual and the body of the bars tends to overlap with the body of previous one. This likely means that the present wave is a counter wave and we might see further ascend in the furture. 

However, if  the double top formation valid, then its target will be 22,892.

Next week will be interesting for Nikkei. will Nikkei break through 55-week moving average presently resisting at 27,673?


Fig 3. Hang Seng weekly chart

Of the  3 indices, the surge in Hang Seng is the strongest. In my earlier entry I estimated a support level at 18,500 points, Hang Seng managed to hit this point by Tuesday before it rebounce upward. 

However, I am still not very optimistic about Hang Seng, I believe that Hang Seng has not finnished its descend yet.  There are a few reasons for my prediction. 

To start with,, there is a HUGE double top stretching through 5 to 6 years starting from 2016,, and it has just broken its neckline. If this is true, the target of Hang Seng is 8,447! Will this level be seen on Hang Seng one day in the near future? I think both Hong Kongers and the China officials will want Carrie Lam's blood when this happen.

Another factor has to do with the moving averages, the gradient of their descends is increasing, meaning that they are gaining momentum. While we are seeing a strong reversal this week and it is possible that Hang Seng continue to rise higher the coming few weeks, the resistance result fromthe moving averages will make it hard for Hang Seng to cut through. Hong Kong will really have to be VERY DETERMINE to achieve this. My feel is that it is going to be resisted by the 55-week moving average which is now at 25,029.


Labels: , ,

3/13/2022

What is USD doing?

 While the war between Ukraine and Russia is on-going this week, there as been little change so far on the direction of the few indices that I was focusing on, they are still on the way down. 

This made me wonder how the currencies are doing right now, in particular SGD?

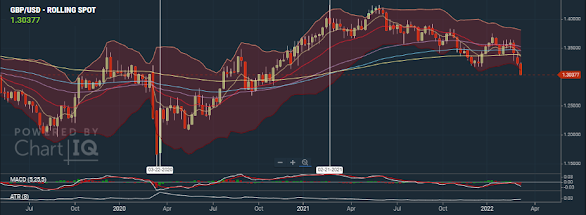
Fig 1 GBPUSD weekly chart
Fig 2 EURUSD weekly chart
Fig 3 USDJPY weekly chart
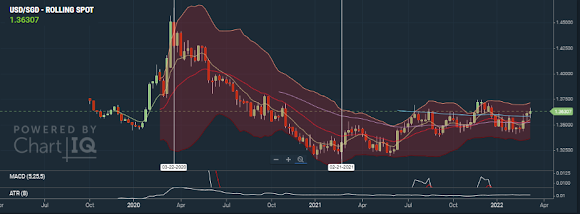
Fig 4 USDSGD weekly chart

Not that I am spending a lot of time and effort in analyzing individual charts, I observed one common behavior from these charts.

USD is getting stronger. This can be seen from both EUR and GBP weakening against USD while USD strengthening itself against JPY and SGD. Imagine that! After printing so much money USD actually become stronger?

It is also interesting to note that USD strengthening itself against both Asian currencies  since 3rd January 2021 while it was not until 21st Febuary 2021 that the 2 European currencies weakening against USD. Yes, it is 2021 and not 2022, it is not the Ukraine-Russia warfare that cause this. 

The strengthening of USD against EUR and JPY is more serious than GBP and SGD, Its rise against GBP and SGD is more gradual, both are either breaking through or just broken and retested the moving averages.. EUR and JPY on the other hand have their trend set since last year (March 2021 for JPY and Oct 2021 for EUR).

Among the currencies, is there any that are strong against USD?

Fig 5 AUD andd NZD weekly chart

I am placing these 2 charts side by side because they look like twins. Both counters actually weakened against USD at the same time as EUR and GBP , on 21st February 2021. However, both descents stopped on the week of 30st January 2022 and has been climbing since then. 

They are both testing multiple moving averages at  this point of time. From the looks of it, it is possible that they ill continue to rise against USD in the near future. What cause me o conclude as such?

I am looking at the behavior of its higher time frame moving averages, they do not seem to be interested in crossing while converging on each other. So even if they cross, it is likely that the crosses are weak. Further more, there seems to have more momentum for these 2  chaps to move further up.

Nevertheless, we might see both counters to draw back a little before moving forward.


Labels: , , , , ,

3/05/2022

The result of being emotional

 In the last 2 weeks, my entries have been emotional. As a result, my analysis were biased.  

This is especially so when I looked at the chart of crude oil. When I looked at the chart, I very much wanted it to go down, deciding on its direction based only on the formation of a shooting star. Further more,  my focus on the Russia-Ukraine war in my entry spent up my energy, and the analysis of the oil chart became less crucial in comparison, I became dis-interested when looking at the chart, leading to yet another wrong analysis.

Of course some may say that " this guy is an idiot by not factoring in the fundamental of the war", it may be true to some extend and I have accepted the principle that price factor everything in technical analysis, thereby holding the belief that all information can be obtained from the chart.

So what shall I do? 

My entries have to focus more on my chart observation and if I am into a unfamiliar territory (such as crude oil chart with different setting), I will have to be thorough in my analysis before concluding its course. If my entry is to focus on other topics, I really should use my other blog.

So let's go back on charting. Few weeks ago, I talked about indices alignments and confirmations, basing entry on Hang Seng, Dow Jones and Nikkei. So far I got it right on both Dow Jones and Nikkei, while  slightly off on Hang Seng. 

Fig 1 Hang Seng, Nikkei and Dow Jones weekly chart

I estimated that Hang Seng should moved up-ward until it reaches 55-week moving average before continue on its descend. It actually retested the 21-week moving average and failed. This led to its continual down slide.

It is also interesting to note that the week prior to the war, hammers were formed for both Dow Jones and Nikkei. Apparently the market was anticipating the beginning of war in the coming week. Well the war has begun this week, why is it that these 2 counters failed to go up, since wars normally result in a surge in the market?

My guess is that while the invasion led to the unity of Europe and mobilization of  troops to many eastern countries of the European union as well as weapon donations to Ukraine,  they stop short of active participation in the war. Instead they resort to sanction to pressure Russia to withdraw, while it will really harm Russia in the long term, sanctions are seldom effective. As long as people can endure the hardship and continue to  allow  their country (Russia and Putin in this case) with their actions, the war drives on.

Noting Newton third law of motion, For every action, there is an equal and opposite reaction. Sanction on Russia also means  damages on those who execute that sanction, as a result, it could harm the countries that enforce the sanction.

At present, Hang Seng reaches its minor 100% projection support  (single wave), there is a tendency that  it may correction at this point. Considering the 55, 89 and 144-week moving averages crosses each other at the same spot, there is a chance that Hang Seng will continue to slide further.

Nikkei is also interesting because its descent is stopped by 144-week moving average, at the same time, it is quite clear the formation of a double top with its objective measured around 23,004. This also coincide with its 161.8% projection level. Its 8-week moving average is also crossing 89-eek moving average with a golden cross,  making its further descent more plausible.

While the many media praised Biden on his state of the union speech, the market nevertheless not impressed, even with such a strong rebound with a loooooong handle hammer, it failed to climb and resisted by its 55-week moving average. It seems to show some weakness in the US market. At present it hovers at its 61.8% projection support, normally I will classify this as weak and mostly a correction or a minor congestion before it continue with its descend. The next support level I see is 29,844. If this is so, US market may be in trouble.

Labels: , ,