Google
 
Web thoughts-denzuko1.blogspot.com

My Charting Blog

It is interesting that I start off this Blog when the Singapore Stock Market is heading south. However, this makes it more interesting for me to write on as the market turned volatile. My interest is Technical Analysis, TA for short. I love to look at charts and predicting where they are heading. This blog is or me to record my thoughts on the market. The articles on this blog are based solely on my personal opinion on the charts that I read and readers should not take it as absolute.

3/09/2026

Oil is not looking good...

Well, the war has started with US and Israel attacking Iran. The commodity affected most is definitely crude oil. Iran is an oil producing country supplying mainly to China. It is also a threat at the mouth of the Red Sea, stopping oil shipment from Saudi Arab. It will definitely cause a stir on oil as a result.

I have captured news on hike on oil prices since the war started. But since I am no longer driving, I thought that if might not affect me that much. 

Curiosity still drove me to check on this counter, though.

The last time I did a piece on oil was Crude oil is cooling down dated 12th May 2024. I was adamant at the time of its immediate support at between 60.41 to 71.06, with possible extension to 28.79 to 54.12 should the prior level failed.  

It reached a low of 55.30 by 5th May 2025, maintaining a horizontal congestion for some time. This came very close to the higher side of my lower zone predicted. 


Fig 1. Crude Oil Light weekly chart

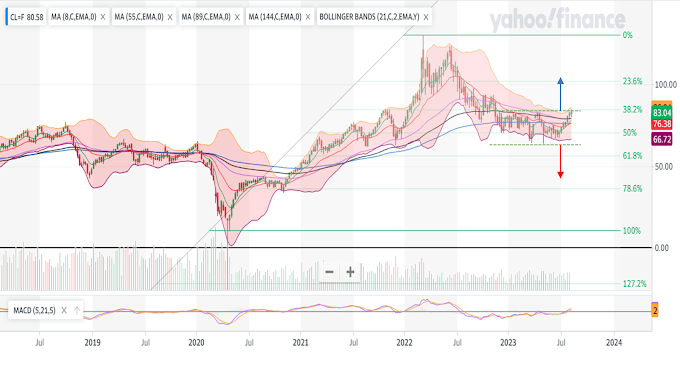
However, as can be seen from the chart, while it has been on a decline since its peak of 130.50 on 7th April 2022, its gradient was very mild. this indicated counterwave move. This is confirmed by continuous overlapping highs and lows. This in fact created a wedge stretching multiple years. 

Breaking out upward is definitely a certainty. The question is: How far?

With the measurement started from the negative zone of -40.32 on 20th April 2020, it allows a long stretch on breakout. estimating using its projection, I am seeing the 61.8% projection resistance level at 160.48. This follows by its 100% projection of 226.97.

Certainly, these values are unthinkable for us right not. At the same time, it is a logical measurement using Projection pattern.

As of last week, crude oil shot up in a long single bar. I will consider this a relatively good news. Why? This an over reaction from the market. 

While Crude Oil opened this morning with a continuation upward, reaching a high of 119.48, resisted by its 261% projection of 119.11. 

It has since retreated. As of the time of this entry, it is at 101.19.

I estimate that it will continue to retreat, correction downward for now, with its support at 67.54. 

However, it is not very good news over a long period of time, because the trend direction is now set upward. The long-term estimation that I have set is a possibility. 

This is not a very good outlook for our coming future, it means that the energy that we are obsessed with is going to be very expensive.

Labels: ,

5/12/2024

Crude oil is cooling down

In my last update on Crude Oil titled Cost of living is going to creep up again....., I felt that while Crude Oil is climbing, it is range bound within a congestion band. Furthermore, the trade volume was thinning indicating weakness in its upward movement.

The rising cost of petroleum is more due to strengthening of USD against SGD, I estimated that there will be resistance at 1.36376 for SGD.


Fig 1. Light Crude Oil weekly chart

It seems that Crude Oil has recently broken through its congestion envelop with continuation downward.

It is presently locked in both resistance from 55 and 89-week moving average while supported by its 21 and 144-week moving average. At this point, I will consider its 55-week moving average to be most important, if it manage to break upward in the coming week, 

Its down trend comes with an increased in volume with MACD crossing downward.

The potential of further continuation is high base on the present read. Even so, I consider its 55-week moving average to be most important, if it manage to break upward in the coming week, it may reverse.

In its more major trend, there is support between 28.79 to 54.12. Its more immediate support to between 60.41 to 71.06.

What about the other factor, SGD?

Fig 2. SGD weekly chart

SGD is trickier, it reached the resistance level I have estimated earlier, which is also the 61.8% projection. While its drop was quite significant, it was supported by its 144-week moving average. it broke through this support this week, supported by its 55-week moving average.

One thing that I have also noticed here is a 3-wave pattern (upward) prior to its continuation down trend on 2nd October 2023. Its second up trend since 25th December 2023 also seem to be in a 3-wave formation. In addition, the latest descend has already violated the high on12th February 2024.

There is a mild divergence on MACD with higher high on chart comes with a lower high on MACD itself.  In addition, MACD is crossing downward. 

Presently, SGD reversed from its high of 15th April 2024, coincidentally a 61.8% projection of a major move and 100% projection of its minor move.

Couple with the alignment of the moving averages, the potential of down trend is relatively high.

Where are the supports for SGD?

Its more immediate support level between 1.3059 to 1.3293. If this is broken, the next support level will be 1.2873.

What if it breaks upward? Then the resistance upward will be 1.3875.

Labels: ,

3/30/2024

Cost of living is going to creep up again.....

It is a short week this week because of Good Friday. Even so, Not all the market would be closed. Japan for instance, won't close for Good Friday, would it? I would at least go for Nikkei trade in the morning, or so I thought.

I woke up at 5:45AM, did my morning routine and by 7:15AM, I was at my work desk, have my laptop and PC turned on and I was ready.

As it turned out, Nikkei IS CLOSED on Good Friday! Anyway, no plan for Good Friday, we ended going for lunch then grocery shopping before heading home, ending the day with dinner at my mother-in-law's home. Quite an unhappening day.

On a sidetrack, I checked on the internet over news on JB crossing. Without surprised, both entry to JB from Singapore were jammed, and it is difficult to say which one was worse. I could only gauge from the queue over the second link which was close to reaching the exit from Singapore custom that it would be at least 5 hours wait before reaching the Malaysia CIQ. 

I really wonder, "why many Singaporeans are so hard up on heading to Malaysia on every opportunity?"

Definitely, Currency exchange has something to do with the urge, Afterall, Kiasuism is an identity of Singaporeans. With inflation creeping up and cost of living over the roof in Singapore (led by government initiatives), heading to a country with your money is multiplied 3.5 times or more is definitely a great draw, even when you may need to wait 5 hours for it, one way. 

Otherwise, is there possibility that Singapore economy is not doing well to the extent that Singaporeans shorten their distances for oversea trips, road trip instead of flying to a faraway place. Certainly, the crossings were not that jam pack 10 years ago and a trip to Malaysia was not high on Singaporeans agenda.

It all come down to affordability, and speaking of affordability, I think driving may be less affordable in the near future, why? Crude oil and USD are creeping up.

It was not long ago that I did my updates on SGD (Now that SGD reached its 55-week moving average, what is next?) dated 2nd March 2024 and Crude Oil (It is Crude Oil's turn after SGD) a week later on 10th March 2024.

I estimated that SGD might reverse at 55-week moving average while Crude Oil has limit in it climb.


Fig 1. SGD weekly chart

While SGD went down as expected the week after my last update, it reversed before reaching my predicted target. It broke through the 55-week moving average and stayed above the level by the end of this week.

This led to new development in SGD with an upward possibility. Using Projection, I can see that SGD is now reaching its 61.8% projection resistance. Furthermore, there seems to be momentum to head higher. 

I may see mild congestion at this point before it goes higher to 1.36376. This level also coincides with its 78.1% retracement level.

Nevertheless, its higher degree moving averages for the moment still maintain tendency of downtrend. 

What of crude oil?


Fig 2. Crude Oil weekly chart

Crude oil is still attempting to climb upward, at the same time, it is facing resistance by its Bollinger band at 82.81, and at this point of time, Bollinger envelop is not relenting its position. The envelop also close to its 61.8% retracement @ 84.13.

It is also interesting noting that the volume of trade is reducing as it climbs higher. This is sign of divergence in crude oil.

For the moment, the reading from the previous entry still stand.

Labels: ,

3/10/2024

It is Crude Oil's turn after SGD

I normally conduct a read on Crude Oil when I work on SGD. I did not last week, why?

I was lazy and I wanted to rest on a weekend. Furthermore, crude oil did not seem to be going anywhere. At least not yet. I was thinking to myself, " Let's take it easy."

While USD truly weakens against SGD this week, I am still pumping gas for my car at the same price. It only means that the oil price has not been down, or down but not that much.

Let's do a read on crude oil this week then.


Fig 1. Crude Oil weekly chart

In my last update on this counter, I estimated that it will tend to move up with resistance from its 55-week moving average.

It is there right now. The interesting part is that its gradient while moving upward is very gradual, indicating a weaker momentum as compared to its down trend. 

Is it going down already? 

It has not shown me indication of reversal, I believe that it is not ready. There may still be some distance to go before it decides to head downward. 

Where do I see the resistance? We should see resistance zone between 87.11 to 99.10. I consider its 87.11 to be more crucial as it also coincides with the Bollinger envelop (86.05) presently. 

At the same time, support level is also attained through its major move with support zone between 28.17 to 53.71.

However, this is subjective considering a potential reversal at the Bollinger envelop, which will provide a new support zone if it turns true.


Labels: ,

1/06/2024

My cost of petrol went up, but not because of oil.....

The last time I did an update on crude oil and SGD was Did SGD get weaker? dated 1st November 2023, that was about 2 months ago. 

I estimated at the time that SGD will continue to strengthen against USD with support level of 1.30320 to 3.1723 for SGD=X chart. 

As for crude oil, it has broken its 144-weekly moving average support of 77.78, withy next support level between 53.71 to 63.64, its previous low.

The petrol price has been stabled at SGD2.810 for the last few weeks. The price, however, went up to SGD2.830 when I went for the pump this week.  

This made me think, " has the oil price gone up so drastically last week?"

Why am I sensitive about the oil price?

I noted a potential reversal signal on oil price about 3 weeks ago. However, I was hesitated in logging in my observation considering more information needed. 

Earlier this week is the crossing to a new year with Esso announce shutting of its operation for system adjustment due to its 1% GST increase. 

Esso is not alone in this; many entities reportedly increased their prices siting the 1% GST adjustment. 

Toast Box for instance came up with an essay to explain why they have to increase the price of their kaya toast and local kopi. ignoring the fact that they are already charging premium for something that cost less than SGD2.00.

However, it is not difficult to see that GST is an excuse many use to increase their profit margin.

So is the increase in petrol price the result of crude oil reversal, USD strengthening against SGD or the 1% GST hike?


Fig 1. SGD weekly chart

Since my last entry, SGD hit a low of 1.3144 last week before recovering with a long bar this week. Its recovery is only stopped by its 8-week moving average. However, I suspect it may be in a correction with its 55-week moving average resistance of 1.3497. 

At the same time, I still feel the general direction is still down with USD continues to get weaker. It is presently within the support zone between 1.2998 to 1.3568. It may retreat to its 61.8% projection level before continuing downwards to 1.2998. Next level of support will be 1.2592 if SGD breaks out of this zone.

Its recent correction between January to October 2023 also created a Zig Zag pattern allowing me with another projection estimation with support between 1.2306 to 1,.28626.

I suspect the best position of reversal of SGD at this moment is between 1.2592 to 1.2826, which is the crossing of both projection measurements.
Fig 2. Light Crude Oil weekly chart

There is not many changes with Crude Oil readings. While the bar on 10th December 2023 demonstrated a potential reversal showing a hammer. However, the hammer seems week and the behavior that follows seems weak and struggles to break through its 8-week moving average resistance. 

There is a potential to move higher though., with next level of resistance of 79.35 from 55-week moving average. This considering the crossing of MACD at this point. 

Should its 55-week moving average resistance broken, its previous peak of 95.03 is crucial.

The direction for the moment is still down based on the present set up. Crude oil is still moving within a channel (in green shade). The support levels for this direction are between 28.17 to 53.71.

I believe the price of petrol should be heading higher, but the present increase is not due to crude oil, and it is the power of GST hike. 


Labels: , ,

11/19/2023

Did SGD get weaker?

 I did a piece on Malaysia titled On the road to radicalization under the leadership of Anwar Ibrahim on 28th October 2023. I was negative on its overwhelming support for Hamas as I feel that the direction it took is not conducive to the progress of the country. It is an act of the prime minister to redirect the people away from the governance incompetence of his government.

MYR indeed weakened on the week that followed, but also created a potential reversal signal. MYR further strengthened against both SGD and USD the subsequent week. I was anxious with the new development. Was I wrong in my analysis?

My first reaction was to change my position, after all, it did seem like a trend reversal. 

However, there is something in me telling me to hold off my decision, patience!

First off, the changes seem impulsive, and market may be reacting too some surprises. What I found an article on USD titled US Dollar Drops Sharply As Weak Data Puts Recession Fears In Focus

It probably spooked the market and lead to a plunge in USD. On the other hand, it made MYR seemingly strengthen against USD. However, it did not explain why it also strengthened against SGD. 

In the end, there are many things on the world that I cannot explain, and it worthwhile not to pursue this route. Further more, it may lead to a subjective misread on my charts. 

So another week has past and I  felt may be there is enough bars to see if SGD has indeed weakened against MYR.

Fig 1. SGDMYR weekly chart

SGDMYR actually broke through the previous high of 3.4938 before it retreated from the new high of 3.5166. It fell to 3.4164 before closing above the 21-week moving average. The downtrend is relatively weak with such a long tail. 

Further to that, the bodies of the bars overlapped during this down trend. it is a kind of indication that there is hesitation in its move and SGDMYR is possibly in a correction phase. 

A harami is formed with this week's movement closing above the 8-week moving average. Dow it mean that it is reversing again? It is a possibility, but there is a need for confirmation bar.

It is still possible for SGDMYR for further downslide, with the urge for the chart to touch its 55-week moving averge and the 100% projection support level of 3.37.  

What is the upside? 

If we are seeing continuation at the point of time, we should still be seeing 3.6225 after retesting 3.5176.

However, it is only a comparison between SGD and MYR. What about SGD itself?


Fig 2. SGD weekly chart

In my last update on SGD in Oil creeping up? I estimated strengthening of SGD against USD as the pair was touching the 55-week moving average. It did not.

Instead, USD strengthened further against SGD peaking at 1.3763. Coincidentally, this is the 100% projection resistance of its minor move. 

It did reverse down there after.

The weakness in the US market brought USD back below the moving averages, which also support further down trend. In addition, the MACD has also crossed downward, further supporting the notion of further downslide.

While the bars also overlapping which for me is indication of counterwave, it seems there is stronger momentum to go further south. 

However, there are a few support levels that is crucial for this trend.

First off, the previous low of 3.1723.  Crossing this level will give a clearer indication of its direction. Below it is 1.30320, which is the low of 29th January 2023, reversal of the previous down trend.

The other levels will be the major projection support between 1.228862 to 1.285007. 

Fig 3. Crude Oil Light weekly chart

With stronger SGD against USD, one other chart that I will look into is crude oil, which was the original intention of this entry. I noticed recently that the petrol price came down while I was pumping fuel to my car, it is worthwhile checking up on.

In my last analysis Oil creeping up?, Crude oil was congesting. I placed 2 scenarios over where it may be going. On the upside, I have placed the range of 92.34 to 94.746 as its resistance. 

Oil peaked at 95.03 before reversing.

It has since broken through the moving averages this week below the 144-week moving average of 77.78, closing at 75.84.

I suspect that Crude oil may retest its moving averages not limiting to that of 144, 89 and 55 before continuation.

From Fibonacci standpoint, the next level of support is its 61.8% projection support at 53.71. However, another support level worth noting is the previous low of 63.64, which may cause crude oil to reverse. 

If oil manage to break through these levels, then the 100% projection support at 28.17 is a possibility. 

Now it is a little too far fetch, isn't it? How can oil hit this low in midst of such world turbulence? There are already wars on 2 fronts and threat of more happening in the East. Should China not able to handle its internal issue, it will externalize its problem by attacking Taiwan. By then USA will be spread too thin to battle on 3 fronts. These are potential for inflation so how is it possible for oil to go down?

Well, oil has gone negative before, bottomed at -40.32, so 28.17 will still be a possibility.

If, however, Crude oil can hold fast at its 61.8% projection support, we may then witness a surge upward with target of between 169.21 to 234.46. As a consumer, I don't find this appealing.


Labels: , , ,

8/13/2023

Oil creeping up?

My car was coming low on fuel this morning led to a trip to the gas station.

Imagine my surprise to see that petroleum breached the SGD2.80 mark It has stayed below this level for quite a while.

I was aware some instability in USD against other components and it mildly weakened during the last few weeks, while crude oil was in congestion phase. Has something happened the last week or so?
Fig 1. SGD weekly chart

USD was actually strengthening against SGD the ast few weeks, bouncing back from its bottom of SGD1.31744. While alarming, it movement is still within the boundary of its congestion. 

At the same time, it is touching the 55-week moving average. There is a possibility that it may reverse down in the coming week, either a congestion or into correction.

At this point of time, I am not seeing much indication going higher. On a contrary, the indication is still on a down slide, with USD further weaken against SGD. The larger projection measurement indiactes a 61.8% projection support of 1.2670.

However, if the counter breaks the resistance of 1.357, next point of resistance is 1.370 to 1.384.
Fig 2. Crude oil weekly chart

Coincidentally, Crude oil also rised from its bottom 63.64 and surpassed its 55-week moving average 79.13, and it managed to stay above this resistance turned support.

It is presently stopped by the envelop of the rectangle at 83.53 this week. Should it retest this level and manage to break upward, the next level of resistance is between 92.34 to 94.746.

Should it failed to break through, it may fall back to 63.64.

At this point, I really need to cross my fingers hoping that the 55-week moving average manage to hold back the advance of oil and SGD.


Labels: ,

2/02/2023

Why oil price went up?

I was cfilling up the tank of my car the other day and noticed that the oil price went up from SGD2.70 to SGD2.75, I wondered," what the hack?

My last up-date on oil price was quite far away, in Crude oil reversing up...with power..... dated 22nd Oct 2022, I saw the possibility of Crude oil rising back up. It did not happen and I chose to leave it aside.

Since then, Crude oil continued to slide downward, slowly. Which was the reason for my surprise. Has it climbed up from its fall?

Fig 1. Crude Oil weekly chart

At the time of writing this article, Crude Oil fell below the moving averages, went into congestion and lately resisted by the 89-week moving average.

At this point of time, it retreated from 89-week moving average and testing its 144-week moving average. 

I will have to change my view on Crude Oil, that the chance of it heading further south is much higher.

Based on its top formation (double top), its next support level should be between 56 to 70. Using the more immediate set up on the other hand, the projection support lies between 59 to 67. 

These 2 sets of values lie close to each other. I suspect the support will be quite prudent.

 If oil price is on the down slide, what else can cause the increase in oil price locally? Would it be due to SGD depreciate against USD?


Fig 2. SGD weekly chart

SGD is actually on a rapid rise against USD. IT broke the low of the past wave and stayed below the mark.

Looking that the chart, I can use expansion to measure a much farther support line, which lies some where around 1.222. At its worst of 100% expansion, it will be 1.167 per USD.  

Its zig zag pattern on the other hand, measures a support of 1.3003. If this support is broken, then 1.2599 will be the next support level.

Seriously speak, if it comes to SGD1.167 per USD, it is not the matter if we should prepare for tour to US, but the stability of the financial market, both US and the world. US is the world's largest debt holder, through issuance of bonds bought by other countries. The shrinking of USD will lead to a shrinkage of the wealth of these countries as well.

To me it is quite scary.

As for the oil price in my neighborhood?   I am not sure. May be the oil company here is a trend follower? Let's hope that the oil price continues to go down next week.


Labels: ,

10/08/2022

Crude oil reversing up...with power.....

It was quite a long time since my last up-date on crude oil in August 2022 titled Is crude oil creeping up again? I was in opinion at the time that it was congesting, while the support level mentioned in Crude oil up-date 16/7/2022 stated at 86.11.

After months of tranquility on crude oil, we finally received a very bad news on this commodity. OPEC+ has decided to cut production by 2 million barrel a day beginning 1st November 2022! This after the meeting among the 13 nations of OPEC together with the 10 allies of Russia.

It is definitely not good a news for the consumers, it indicates a rise in oil prices especially upon winter arrival, which the northern nations need the fuel most.

It also raised accusation of the west that OPEC is siding with Russia, which was refuted by OPEC itself.

As a result of this decision, the oil price shot up overnight. 


Fig 1. Crude Oil Weekly Chart

Crude oil reached the support that I estimated and went further to a low of 76.25 last week. It also coincides with the support of 144-week moving average. A reversal at this point could mean the completion wave, which I believe is a 3-wave counter wave due to the nature of its move.

The ascension this week is strong with a bar of long body that penetrated both 89-week and 55-week moving averages. This is significant, as I deem 55-week moving average to be a significant support-resistance level. It will then be possible that crude oil comes with a mild retreat to retest the 55-week moving average support before continues on its journey upward.

Where will it be heading?

Using more immediate projection set up (in blue), I am seeing resistance at between 129.98 and 143.73. This will mean a new record for oil, at its worst, it may reach 161.20 (127% projection).

By then the cost of oil will be so unbearable for many countries.  I resist to think what might happen next. At the back of my mind was Desert Storm. Let's hope that we won't go that far. 


Labels:

8/24/2022

Is crude oil creeping up again?

 Well, it is close to mid of the week and by right I am not supposed to have any entry. I just could not help myself, I have to type in something . 

So I went through the charts to take a look at those I have previous entry. I saw Crude Oil. My last entry Crude oil up-date 16/7/2022 was just more and a month ago, I guess it is worthwhile talking about it,  especially WHEN IT HAS JUST HIT A SUPPORT LEVEL!


Fig 1. Crude Oil Weekly Chart

In my last entry on this counter, I measured using projection with a support level of 86.11, which coincidentally near the neckline and the 55-week moving average support level. Apparently there are sufficient number of support to pause the descend.

It is presently resisted by the 8-week moving average @ 94.51 with neckline at 92.93.

So what now?

It seems to me that crude oil has been either congest or into minor correction since 7th August 2022. It is creeping higher this week. In fact an engulfed candlestick pattern. However, as we have yet to reach mid of the week, the formation is incomplete until the end of the week.

It is also worth noting that the trade volume on the rise when the price was coming down and receded upon congestion and rising prices. This is a good sign. What about the bad? MACD is about to cross, if it does so, we might see a larger correction with resistance between 109 to 115 ( retracement resistance ).

 My take is that as long as it does not supersede 98.65, which was the high of 31st July 2022, the chance of continuous descend is still higher.

Let's cross our fingers that it may continue downslide after week, just a reminder to pump fuel by Thursday just in case the gas station increases the petrol price.


Labels:

7/16/2022

Crude oil up-date 16/7/2022

 I have told myself to maintain one entry per week, and just a while ago, I up-loaded an entry on A &P 500 and Dow Jones 30 comparison, so it is a little strange that I have a second entry today addressing Crude Oil.

Well, my original intention as an entry on crude oil, the S & P read was actually the distraction. I did an entry on Crude oil on 26th June 2022 and there has been some development since. While it went the direction that I have predicted, I am concern with the bar formation.

Fig.1 Crude oil weekly chart

On both weeks since 25ht June 2022, Crude Oil fell in the beginning of the week, only to recover back to mid-point by the end of the week, leading to formation of long tail.

While the closing for week of 3rd July 2022 was due to the 21-week moving average and closing for week of 10th July 2022 due to re-bounce from the 55-week moving average. Long tails are showing for both weeks.

What does this mean to me?

I believe it is coming close to a support level, leading to its consistent reaction every time it trends downward. However, it does not translate to a reversal yet. 

I mentioned the neckline at 92 on my last entry. Crude Oil has broken and tested this level this week, and the general direction is still down with momentum, what we might experience from this counter is a correction or congestion.

Until this point, the support level of 86.11 as recorded last round is still valid.

No matter what, when I pump gas for my car today, I am happier, the price at the station has just been adjusted downward. It is certainly more wonderful that oil can go down further.


Labels:

6/25/2022

Crude oil Up-date 25th June 2022

 I promised myself to keep up-dating this blog weekly. That promised was made right before I went AWOL for 2 weeks. Even with reason, it is not justified to do so, it involves discipline which is important to trading.

I went back to Malaysia with my family to visit my parents, I was involved in cooking and running erants the whole week. My parents are in their mid 80s, they stay with my youngest brother who unfortunately was in a divorce proceeding with his wife at the moment. I am kind of worried how he is coping, good thing is that he picked up drumming. My wife tested his drum set and she seems to like doing it as well, she said it is therapeutic. 

I estimated in my last up-date that there is a strong tendency for crude oil to fall and it is a matter of waiting for the signal.

While checking my social media (Facebook.com) this week, I came across a chart on crude oil, it caught my attention. 


Fig1. Crude Oil Weekly Chart

The chart I use comes from Finance.yahoo.com, which I consider relatively good platform for chart read, even though it does not include some tools of my preference.

Signal came the week after my up-date and confirmation with a long bar down. It is stopped by the 21-weekmoving average this week. While seemingly a hammer, the body remains red and resisted by the 8-week moving average.

So where do I think crude oil is going?

Based on my projection calculation (Yes, I have to dig out an older excel sheet to perform the calculation), crude oil is close to reaching 61.8% projection (USD100.46) support this week, explaining the reason for its long tail. 61.8% projection line is however not a strong resistance support, and many times result in a correction instead of  a reversal, this is especially so when it is a bar with long body prior to this, I should expect the next support level to be USD86.11.

If downslide continuation is true, then USD92.00 is crucial to crude oil, it is the neckline of a double top formation. Crossing this line will lead to further objective of USD55.36 for crude oil.

That would be good news for us, isn't it? 


Labels:

5/28/2022

Crude oil revisit

 Things are not going smoothly this week. 

It started with this flu virus ( tested not covid-19 ) going around my family and it is my  turn getting it this week, began with itchy throat, cough and now runny nose. 

Second, I was meant to use my demo trade to test out a system, but order loaded onto my live trade instead, ending with quite a bit of losses. Good thing that I have always practice stop loss and minimized the losses.

For a chang this week, I have decided to revisit crude oil as it recently cost an increase in my cost of living. The last time I did an entry crude oil decided to play a trick on me, going the other way. well, if it is read wrongly, it is my own fault.

Fig. 1 Crude oil weekly chart

To start with, I am using the chart available on https://finance.yahoo.com since the platform I uses does not have chart stretching more than 3 months (due to its commodity nature). As such there are some tools not available to me. Nevertheless, the tools on yahoo.com would be sufficient for the time being for me to conduct a rough read of its development. So what is happening?

Well, the war ( or military exercise as described by Russia ) has been going on for more than 2 months now and Russia is seriously going no where.

While crude oil is again climbing up after its retreat, it's momentum has declined. The weekly fluctuation has indeed reduced evidence from the bar spread, giving me a feeling Do these mean a tendency of reversal?

While I am seeing signs of weakness in crude oil, the 3 moving averages are still supporting an uptrend. What I can assume is the possibility of correction. The looks of the decline provides a possibility of crude oil in a zig zag B wave after an A wave decline. As such, we should see a C wave downwards. So where can the support level of C wave be?

My bet at this point is the 55-week moving average. Furthermore, it is possible to use Fibonacci projection  to provide a more accurate measurement, which unfortunately not available on this platform. Using the present position of 55-week moving average however, we can estimate the value to be USD85.00.

However, I have not witnessed a reversal bar on crude oil yet, so I should not be assuming a reversal yet, even though it is already at the previous high. patience, patience.


Labels: